
Jira Cloud customers have a number of options to export Jira worklogs to Excel.
The built-in Excel export, however, often prove to be insufficient even for the most basic business reporting needs. The exported worklog information is not always presented in a usable format or data type. What's worse, the desired worklog attributes might not be accessible for exporting at all.
(And then we haven't even mentioned the added risk and instability of using a Microsoft Excel add-in instead of a native Jira Cloud solution.)
Tutorial video
Watch the quick tutorial video below and find a reliable method below to export Jira Cloud worklogs to Excel.
Export Jira worklogs to Excel
Better Excel Exporter for Jira Cloud comes with a default Excel template for Jira worklog reports. If Better Excel Exporter Cloud is installed, the report is available as "Worklog Report" in the Excel export popup.
This report collects the basic issue fields like Key, Issue Type, Status and Priority. By default, it also gathers information on Affected and Fix Versions as well as on Components.
Plus, the report automatically adds the worklog attributes, such as Start Date, Time Spent and Author in separate columns:
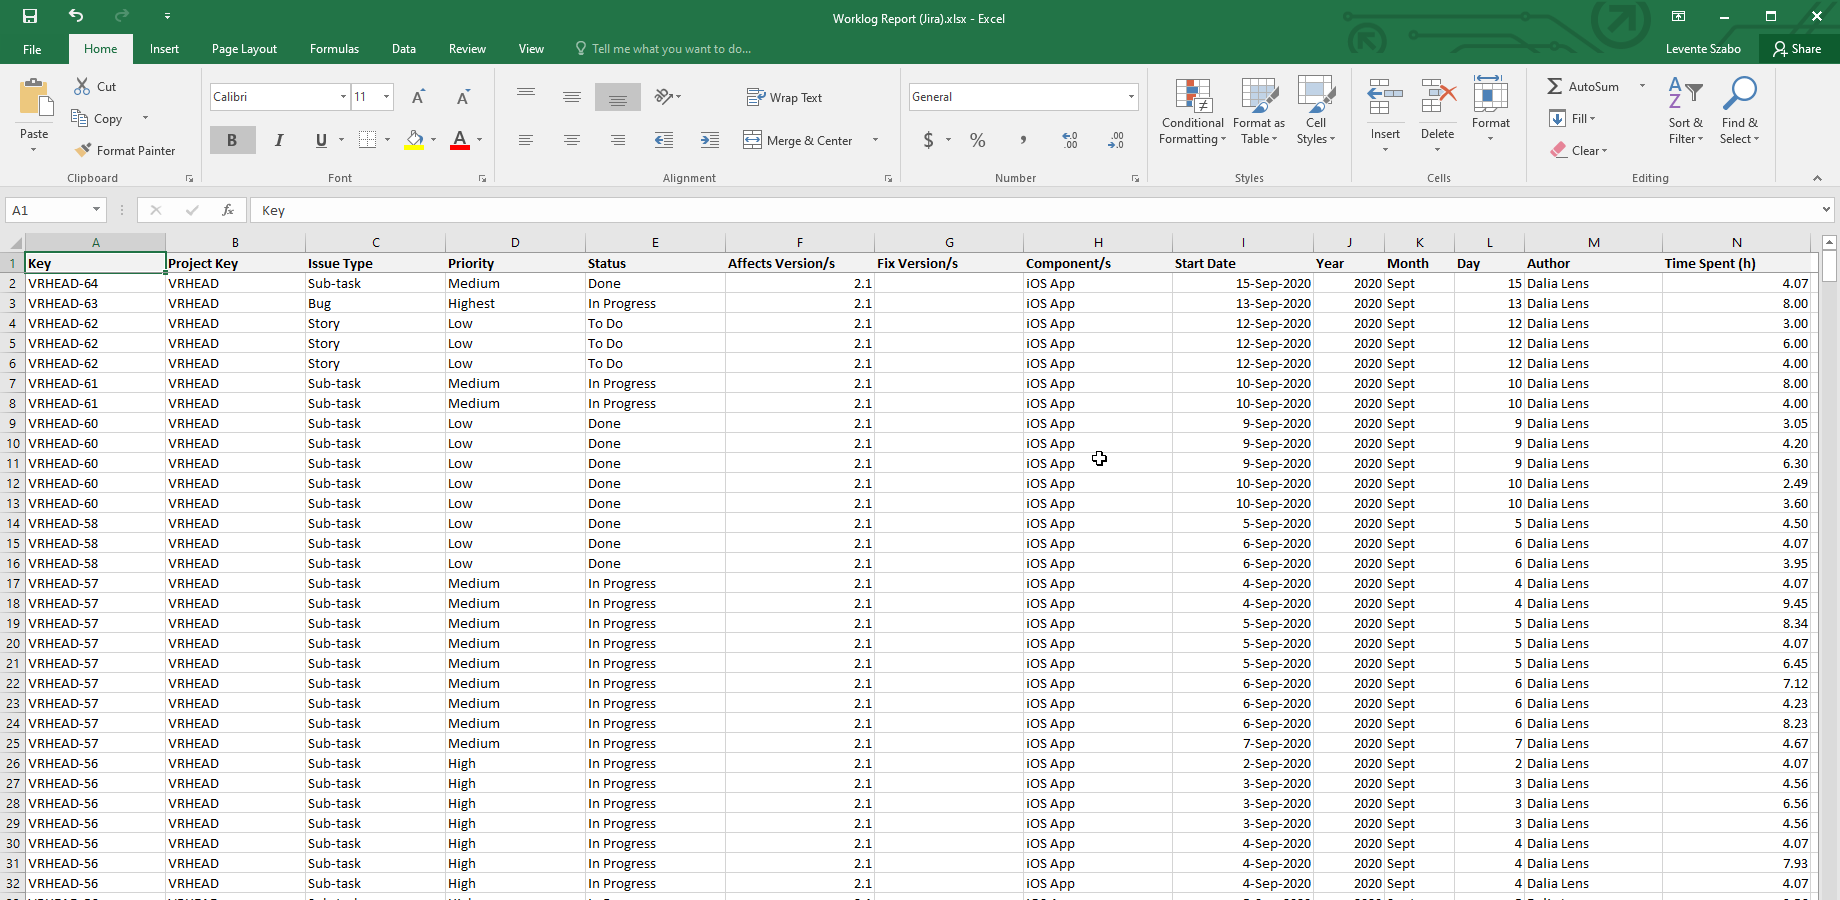
So far this is just the raw data. It will be processed by the Excel worklog report template to create pivot tables and charts and to give actual insight. We will have a quick look at those in the next sections.
Jira Cloud worklog reports
Jira Cloud worklog report by project
The worklog report has different sections on separate worksheets, featuring their own pivot tables and charts.
The first report section is called "Projects". This part of the worklog report is about work hours logged on different components of the Jira Cloud project. This is a native Excel pivot table, which you can customize by turning on and off the pivot table fields.
With the pivot table comes a pivot chart to visualize the data:
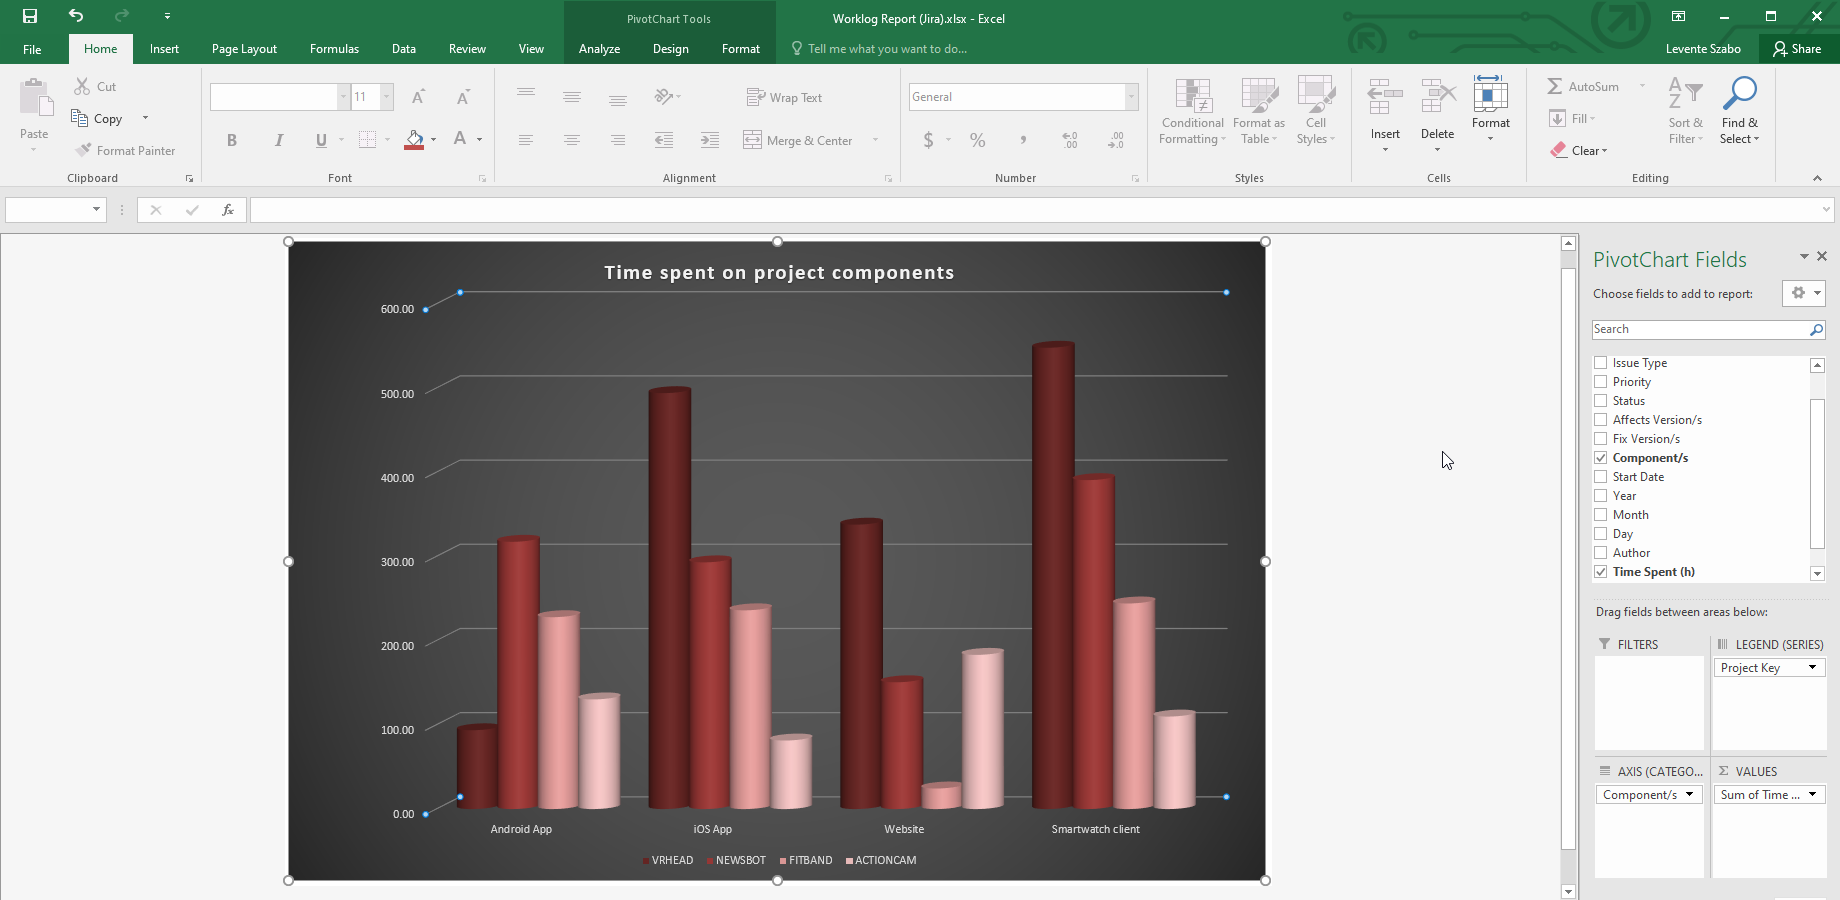
The Time Spent information is always expressed in hours, so it's easy to understand the metrics at one glance.
Generate a Jira Cloud time tracking report like this:
- Collect the issues you want to report on in the Issue Navigator.
- Open the Better Excel Exporter app's export popup (by clicking the larger Excel icon above the issues).
- Choose the "Worklog Report" export option.
- Open the Excel report when downloaded.
- Tweak the pivot table and chart fields according to your needs.
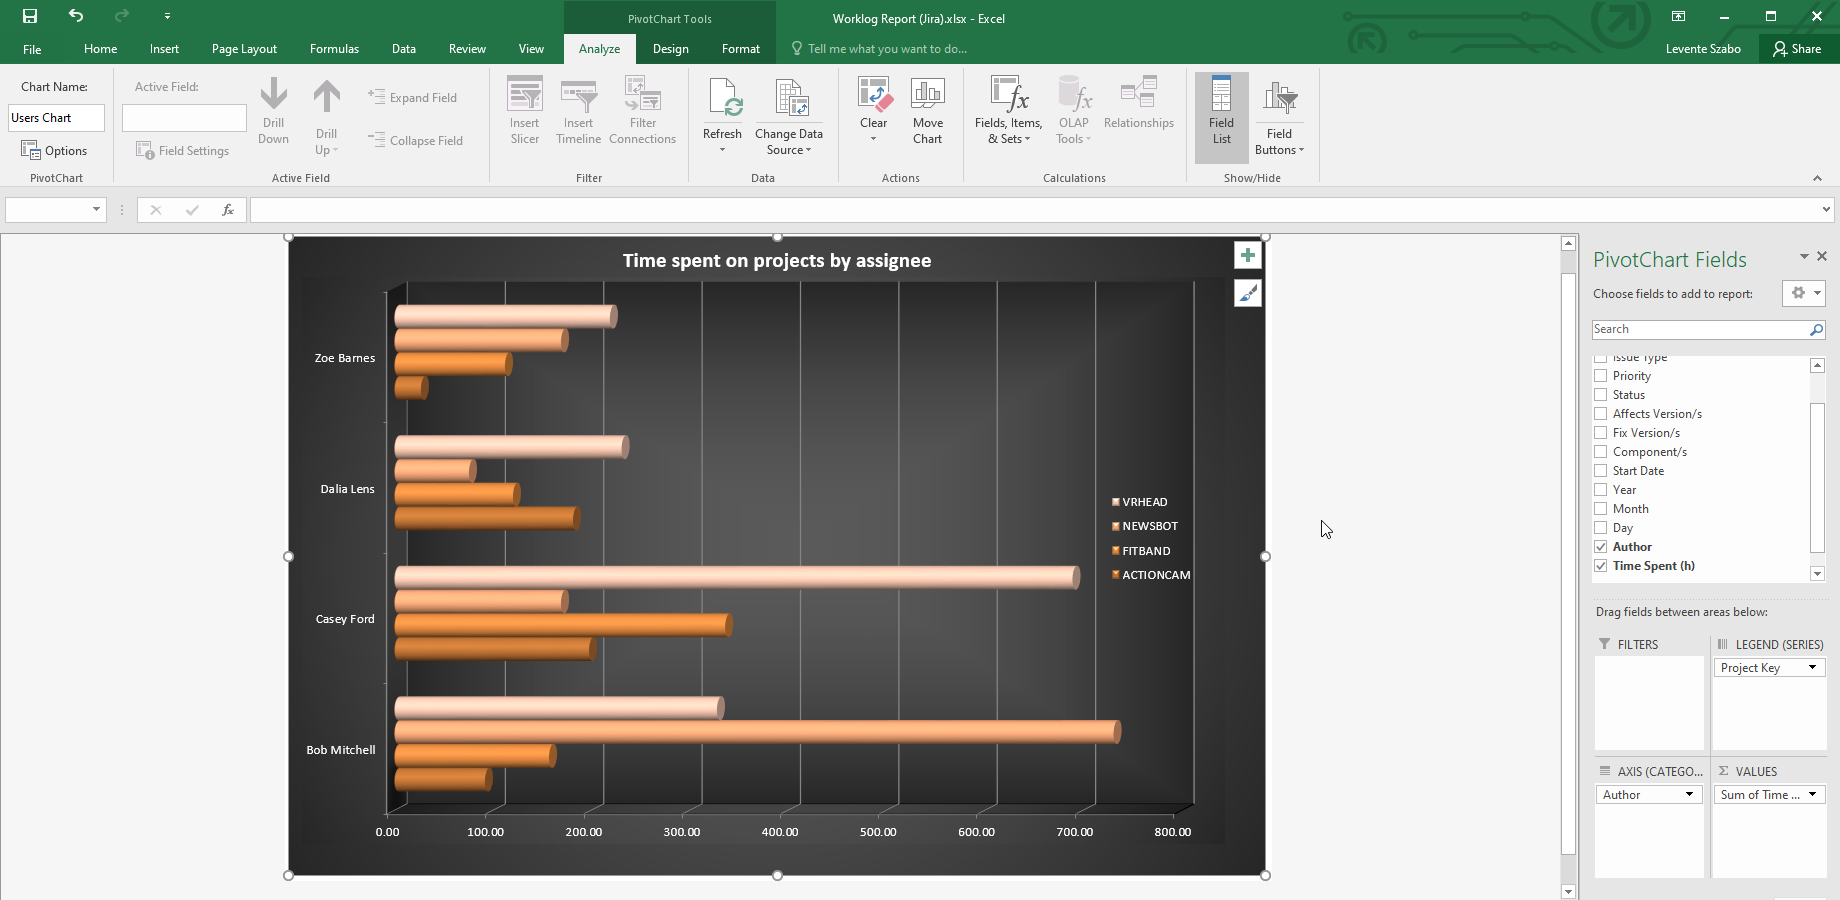
Jira Cloud worklog report by user
The worklog report template exports the worklog author and the amount of time logged on issues. These metrics are plotted to a pivot table to get an analysis of work hours performed by each user.
This can be used quarterly, monthly, or even to get a daily worklog report in Jira Cloud.
Jira time tracking report per issue type
To report on work hours performed on affected versions, select that field instead of authors. This will display the right numbers for worklogs per Jira issue type.
Using pivot tables and charts in Excel you get a different reading of the same set of worklogs. It makes it easy to save different versions of the same Jira Cloud worklog Excel report and use them for different reporting purposes.
Conclusion
The Better Excel Exporter Worklog report is a versatile time tracking report for Excel. It's a reliable method to export Jira worklogs to Excel. It takes the Jira Cloud issue information needed to prepare the perfect Excel worklog report automatically.
You can use the generated report as it is or finalize the pivot tables and charts to tell the story you need.
Get started with a free trial right now and generate a Jira Cloud worklog report in seconds!
Create Jira Cloud worklog reports!
