
A Confluence user activity report is the best way to find active Confluence users. The user activity analytics dashboards help track user activity in Confluence without Enterprise and Premium subscriptions. It also allows you to get a list of active users and top content in Confluence and answer questions like:
- Who is editing the most content in Confluence?
- Who is viewing the most content in Confluence?
- How many pages has the most active author created?
The right tools help you understand user engagement, content interactions, and Confluence page status, available for all, not just for Enterprise and Premium Confluence users.
Better Content Archiving and Analytics for Confluence equips you with robust user activity reports. Find Confluence dashboards to analyze Confluence user behavior for all tiers including free.

Monitoring the Confluence user activity
Delve into the depths of user involvement with the Confluence user activity dashboards, designed to unveil the champions of collaboration and content consumption. Monitor Confluence user activity from a different angle on the user activity analytics dashboard.
Confluence user activity reports
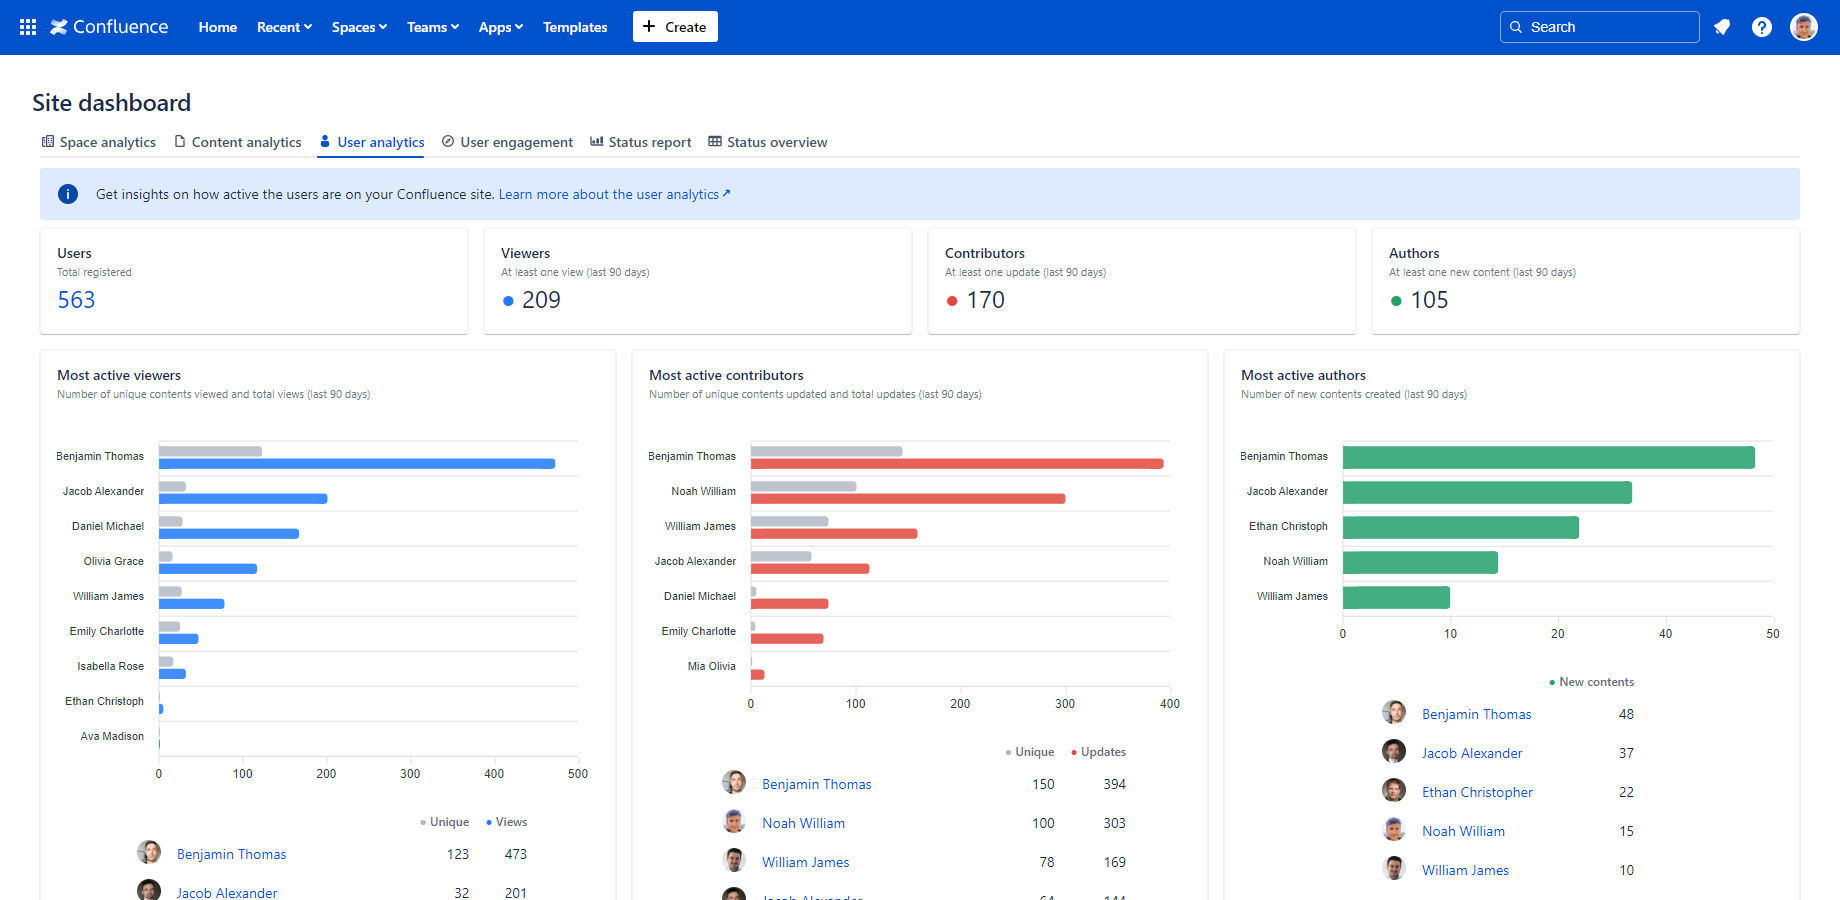
- Most active viewers: Understand which users drive views within your Confluence spaces. Identifying your most active viewers acknowledges their attentiveness and facilitates collaboration by creating connections and recognizing expertise.
- Most active contributors: Track the pulse of collaboration by monitoring Confluence editing activity. Understanding who contributes the most updates can help pinpoint subject matter experts, streamline content review processes, and identify areas for skill development and knowledge sharing.
- Ratios score-card gadget: Garner insights into space level or overall Confluence usage statistics with a holistic view of viewer, contributor, and author ratios. This comprehensive overview enables you to gauge the health of your Confluence space or whole knowledge base and tailor strategies to enhance participation and involvement.
These statistics are not just numbers; they represent the behavior and preferences of your audience. By leveraging Confluence page view statistics, you're equipped to refine your content strategy, ensuring it aligns with user interests and behaviors, thereby enhancing the overall effectiveness of your Confluence instance.
By implementing these strategies, teams can not only track user contributions but also identify areas for improvement, fostering a more collaborative and productive Confluence environment.
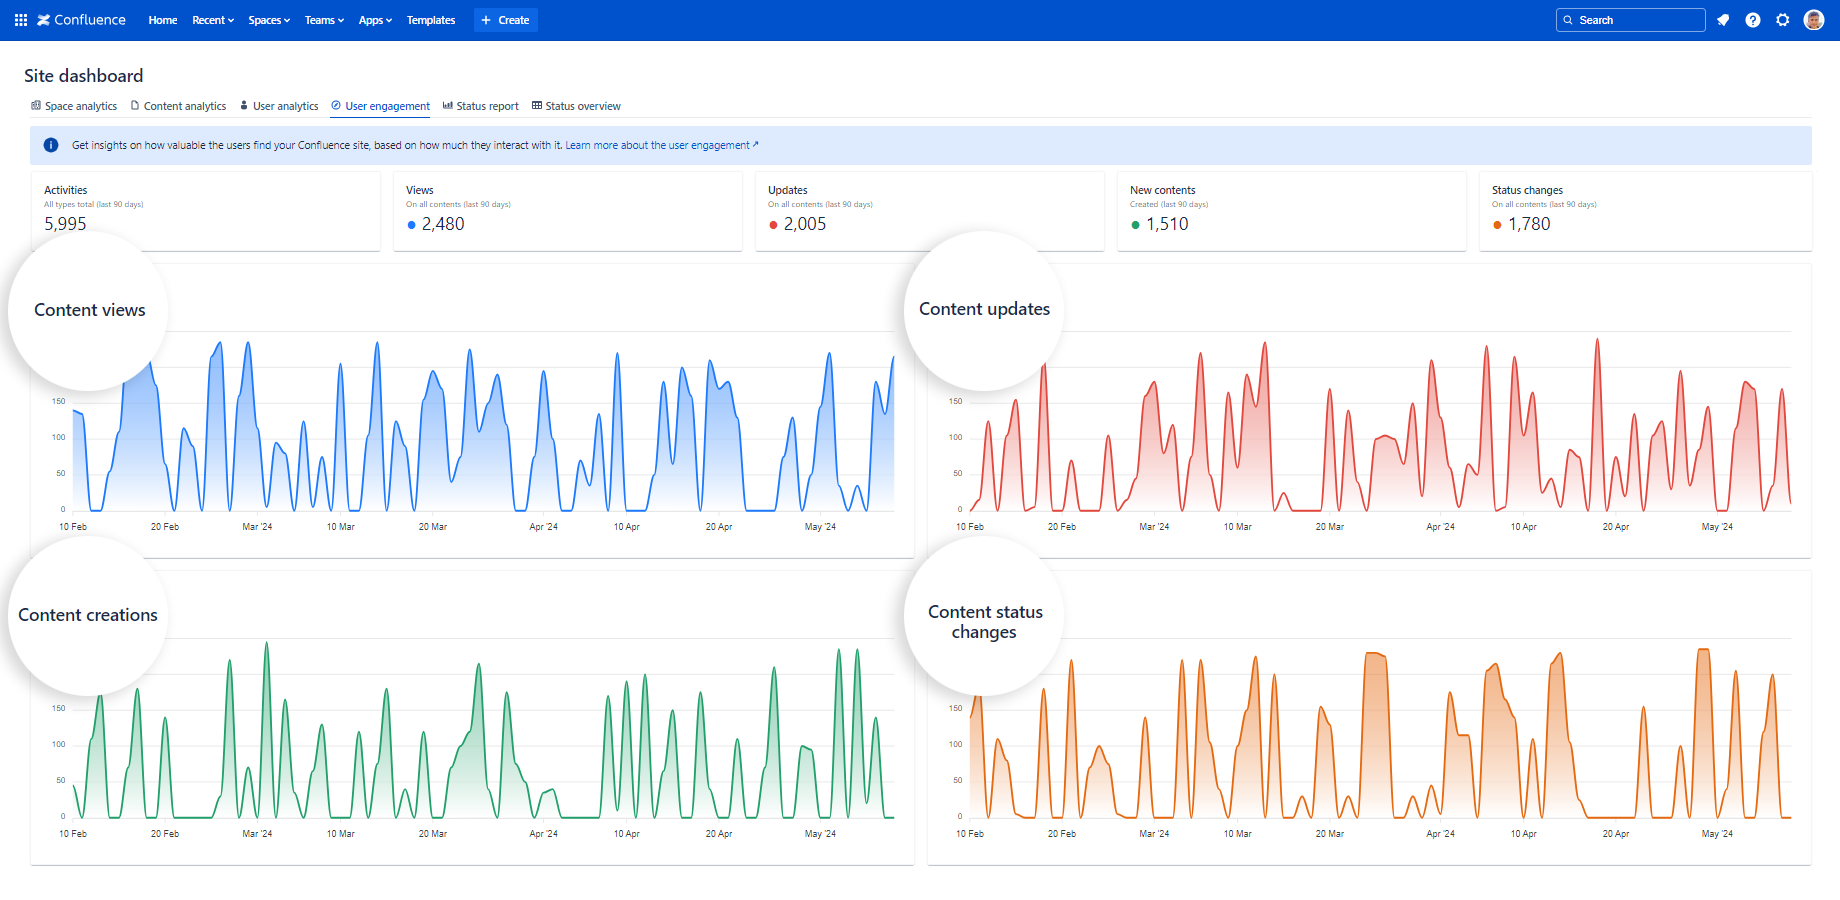
Confluence user engagement dashboard
Peek into the user interactions with the user engagement dashboard. The user engagement dashboard in Better Content Archiving and Analytics provides crucial insights into how users interact with your Confluence content. Here's a breakdown of each user engagement metric.

- Content views: Track the popularity and relevance of your Confluence content through the lens of viewer engagement. Analyzing content views helps assess the impact of Confluence notification emails, and refine the content strategy to meet the evolving needs of your audience.
- Content updates: Follow Confluence content as it undergoes iterative improvements and updates. Monitoring Confluence content updates enables you to ensure accuracy, relevancy, and timeliness, promoting a culture of continuous improvement and knowledge refinement.
- Content creations: Measure the speed of knowledge creation within your Confluence spaces. Tracking content creations helps keep the Confluence spaces' growth in check and highlights the times when user collaboration and new ideas are peaking.
- Page status changes: Stay informed about the lifecycle of your content as pages transition through various statuses. Understanding page status changes facilitates content governance, and ensures alignment with organizational processes and policies.
- Score-card gadget: Gain a comprehensive understanding of user engagement dynamics with a score-card gadget showcasing key metrics. This holistic view summarizes views, contributions, page creations, and status changes across your spaces or within a space. This helps in identifying overall trends and engagement levels.
Improve your Confluence user activity reporting
Delving further into the specifics of Confluence user activity reveals important metrics and reports, helping you make better decisions about resource allocation and knowledge base management.
With page view statistics, space analytics, page status and user activity reports Better Content Archiving and Analytics helps you fine-tune your approach to Confluence analytics.
