What is a Confluence dashboard?
Confluence dashboards serve as static or dynamic reports to visualize usage statistics, helping teams stay informed about Confluence content statistics, and track various metrics.
For many users, these Confluence reports come only through Confluence Analytics, a feature limited to Premium and Enterprise tiers. But Better Content Archiving and Analytics opens access to these insights on all Confluence tiers (including Standard and even Free). This app not only rivals Premium's analytics tools but extends them with comprehensive dashboards for spaces, content, users, engagement, and page statuses.
In some cases, you can even save on Confluence license costs.
If you want to upgrade to Premium only for the analytics or content lifecycle automation features, you should think again. You can get these by staying on Confluence Standard and using the Better Content Archiving and Analytics app. Your monthly bill will increase 80% less compared to upgrading to Premium. This setup can save up to 40% in annual Confluence license costs.
Confluence dashboards by Better Content Archiving and Analytics
Let's explore each of these Confluence dashboards to see how they can elevate your Confluence analytics game and inform content lifecycle management decisions.
1. Space Analytics Dashboard
The Space Analytics Dashboard offers a high-level view of every Confluence space, showcasing KPIs that reveal trends in views, updates, and page creations. With this dashboard, teams can easily track which spaces are popular or abandoned, helping admins make data-driven decisions about organizing, archiving, or reviving spaces based on real-time insights.
Explore our in-depth article on Confluence space analytics to see how each gadget can help your team identify active versus stagnant spaces.
2. Content Analytics Dashboard
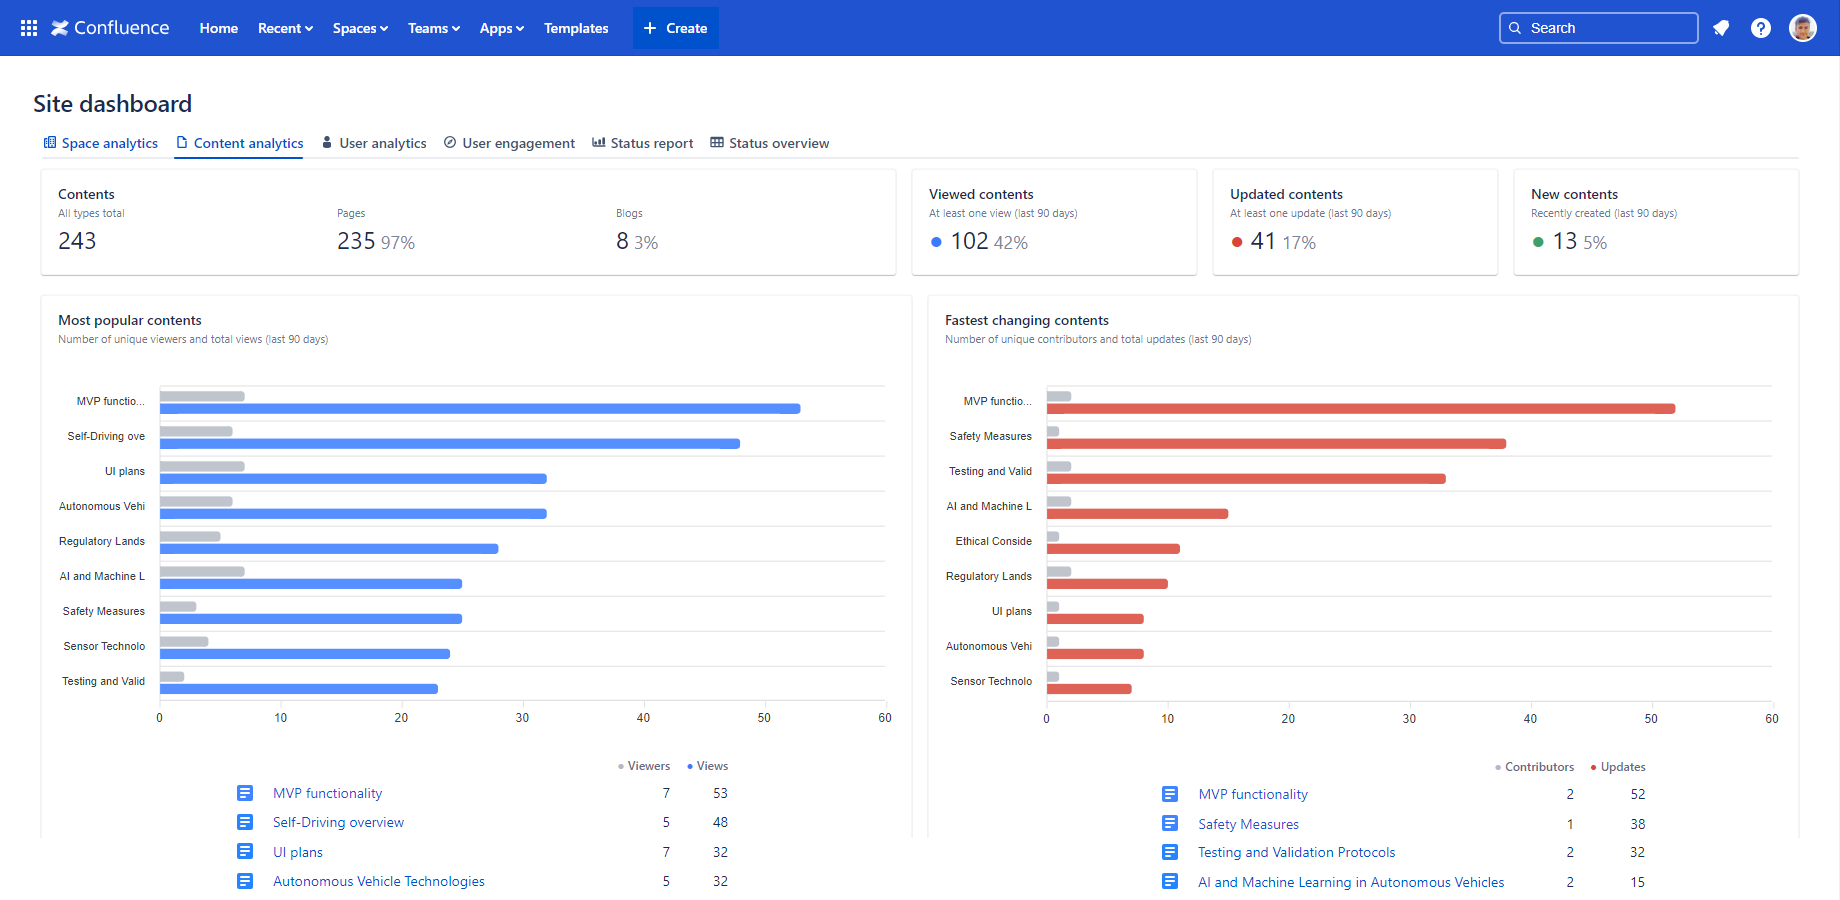
The Content Analytics Dashboard provides insights into page and blog post performance by tracking views, updates, and creation trends. This dashboard is ideal for spotting top-performing content, ensuring critical information remains visible and accessible.
With gadgets dedicated to viewing and updating activity, this dashboard helps teams evaluate content effectiveness, supporting decisions on future updates and highlighting opportunities to refine high-impact content.
Find the most popular pages in Confluence with Better Content Archiving and Analytics
↑ Get this dashboard and more now!
Check out our article on Confluence content analytics to dive deeper into its use for Confluence usage statistics.
3. User Analytics Dashboard
The User Analytics Dashboard tracks user activity across Confluence, identifying key contributors and power users who drive content creation and engagement. The user activity report includes viewers, contributors, and authors at both site-wide and space levels.
View Confluence user activity to monitor collaboration, understand team dynamics, and recognize team members contributing the most.
For more details on user activity metrics, read our guide on Confluence user analytics.
4. User Engagement Dashboard
The User Engagement Dashboard provides data on how actively users interact with Confluence content, tracking views, updates, and page status changes.
With this dashboard, you can measure user engagement over time, assess whether content is resonating with its audience, and evaluate the effectiveness of your team's content efforts. Use this data to foster team engagement and improve user experience.
5. Status Report Dashboard
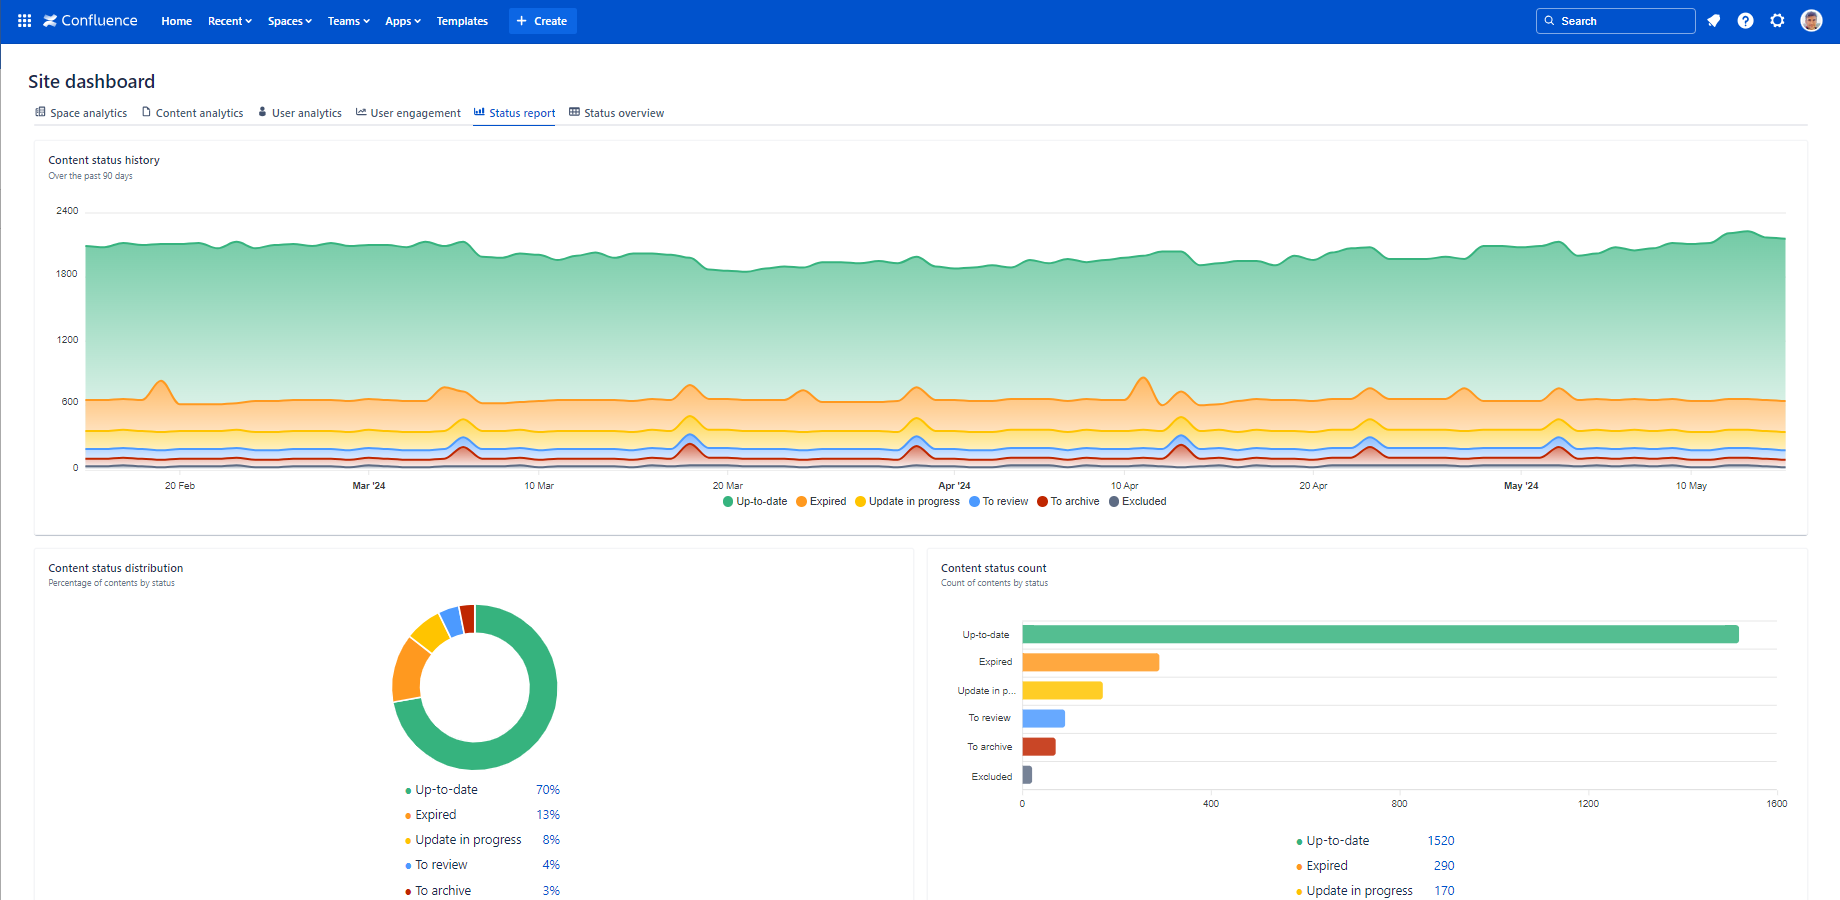
The Status Report Dashboard offers a historical overview of how content statuses change over time, as well as KPIs on the current health of your content.
This dashboard enables teams to track pages across statuses like "expired," "not viewed," and "ready for review," ensuring they can identify and address content gaps efficiently.
Page statuses and historical changes are visualized in Better Content Archiving and Analytics
This powerful tool helps improve content quality by pinpointing content needing updates and highlighting areas for further development or archiving.
To see examples of effective status reporting, explore our article about Confluence page status reporting.
6. Status Overview Dashboard
The Status Overview Dashboard shows the distribution of content by status and space. This dashboard makes it easy to spot bottlenecks as it shows where are the most outdated or unviewed content.
The Status Overview Dashboard works like a heatmap and provides a quick overview of content health across Confluence.
Whether you're managing a small instance or a large site with hundreds or thousands of spaces, this dashboard helps teams prioritize updates and reviews to maintain relevance and accuracy.
Interested in more? Watch our quick video guide on the Status Overview Dashboard.
Making the most of Confluence dashboards for all tiers
The Confluence dashboards inside Better Content Archiving and Analytics give you the power to unlock Premium-tier analytics features across any Confluence plan. Each dashboard provides actionable insights to improve content management, foster collaboration, and maximize content lifecycle effectiveness—without requiring an upgrade to Confluence Premium.
Now it's your turn: will you pay for what you don't need, or choose a solution that delivers powerful Confluence insights tailored to your exact needs?


