
Managing hundreds of Jira Cloud projects is only possible using proper Jira reports with statistics for projects. No optimization is possible without understanding Jira Cloud project dynamics.
Jira reports with statistics for projects are the Jira admin's key to discovering insights about project progress and team member workload.
Better Excel Exporter for Jira Cloud has a built-in report option for Jira projects that can be used for statistics and trend analysis. With a single click, Better Excel Exporter Cloud generates native Excel reports containing project-related metadata.
Creating your first Jira Cloud project report
Just follow these steps:
- Install the Better Excel Exporter for Jira Cloud app.
- Go to the Issue Navigator, and limit your search to a few issues.
- Find the new "Excel export" icon in the upper right corner.
- Select the "Projects" export option.
Your spreadsheet gets downloaded automatically.
Tip: limiting issues (preferably to just one issue) is necessary as the app pre-fetches all issues in the Issue Navigator when beginning the export. However, regardless of which issues are selected, it exports all projects and their details.
Jira project export data
The Excel spreadsheet contains the following information for each Jira Cloud project:
- Project (project name)
- Project Key
- Status (Active / Archived / Deleted)
- Project Type
- Project Lead (user name of the project lead)
- Category
- URL
- Description
- Last issue update
- Number of issues
- Components (list of the components used in the project)
- Issue Types (list of the issue types used in the project)
- Versions (list of versions used in the project)
- Archived Date (exported for archived projects only)
- Archived by (name of the archiver user, exported for archived projects only)
- Deleted Date (exported for deleted projects only)
- Deleted by (name of the deleter user, exported for deleted projects only)
Interested in similar Jira Cloud project reports in PDF format? Check out the Jira projects status report samples made with Better PDF Exporter for Cloud!
Jira project export customization options
The "Projects" Excel export is created using these resources:
- The Excel template "project-export.xlsx" which you can freely customize. You can add or remove columns, change the spreadsheet structure and formatting, as explained in the general customization guide.
- The Groovy script "project-export.groovy" is used to access the additional information to export (last issue update, number of issues, archiving details). You can also modify this script to your needs.
Working with project information in Excel
Importing project data to an external application
You can post-process the Jira Cloud project data in Excel using search-and-replace, Excel functions, re-ordering or removing columns, and so on.
When you are ready with post-processing, you can import the data to the target application (external database, CRM, reporting application, etc.) in XLSX format. If the target application cannot import XLSX but can import CSV, then save your data from Excel to a CSV file.
Creating Jira reports with statistics for projects
The Better Excel Exporter Cloud template exports Jira Cloud project statistics to Excel for reporting purposes. The type of analysis and statistics you create from the raw data is entirely up to you.
Here is a few project report ideas for inspiration.
1. Distribution of active vs. archived Jira projects
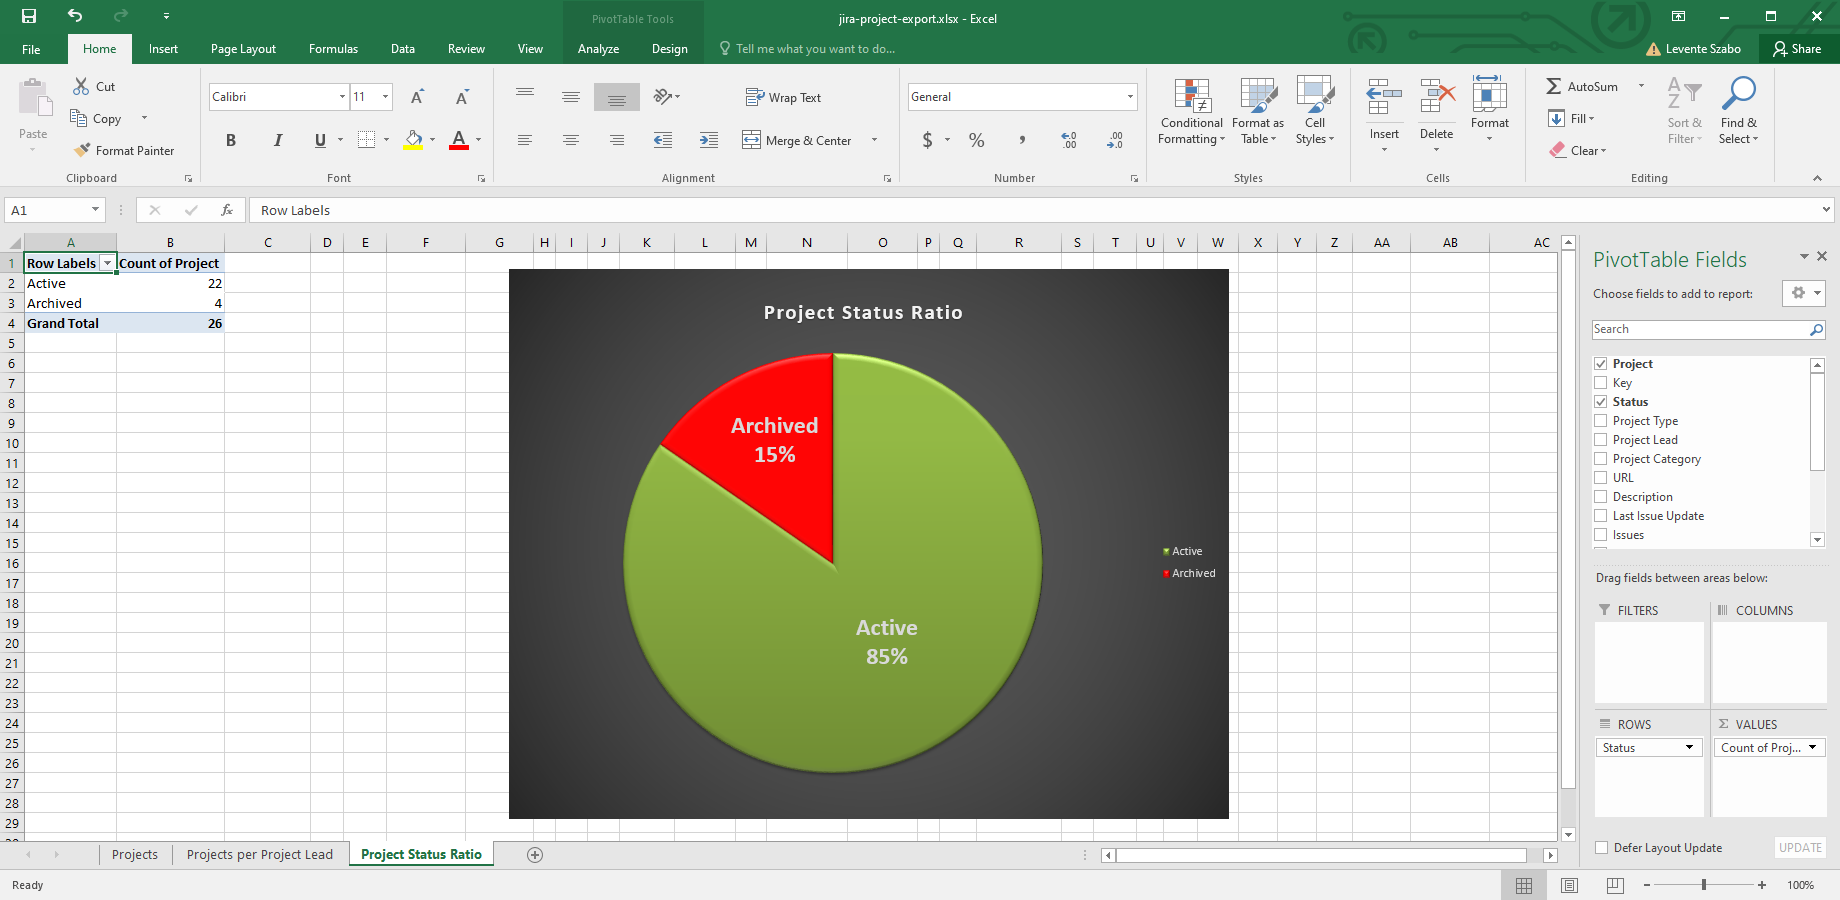
The report gives you information about the status of each exported Jira Cloud project. Projects can be in Active or Archived statuses. You can take that and create a comparison pie chart for visualizing the project status ratio.
Similarly, you can find the ratio of project types, like Software vs. Business projects.
2. Jira project size
Jira project size statistics takes the number of issues in a Jira Cloud project. The more issues a project contains, the larger it is. The report can also be customized to calculate the cumulative size of all the attachments in the project to get a metric with the storage requirement.
The statistical findings can be displayed in a simple bar or pie chart.
3. Distribution of components and issue types per project
Components and issue types for a project are available through the project export template. It helps you understand how issue types and components are distributed across projects.
Find out which Jira Cloud project has a specific issue type, has the most components or the least of them.
4. Imbalanced project lead roles
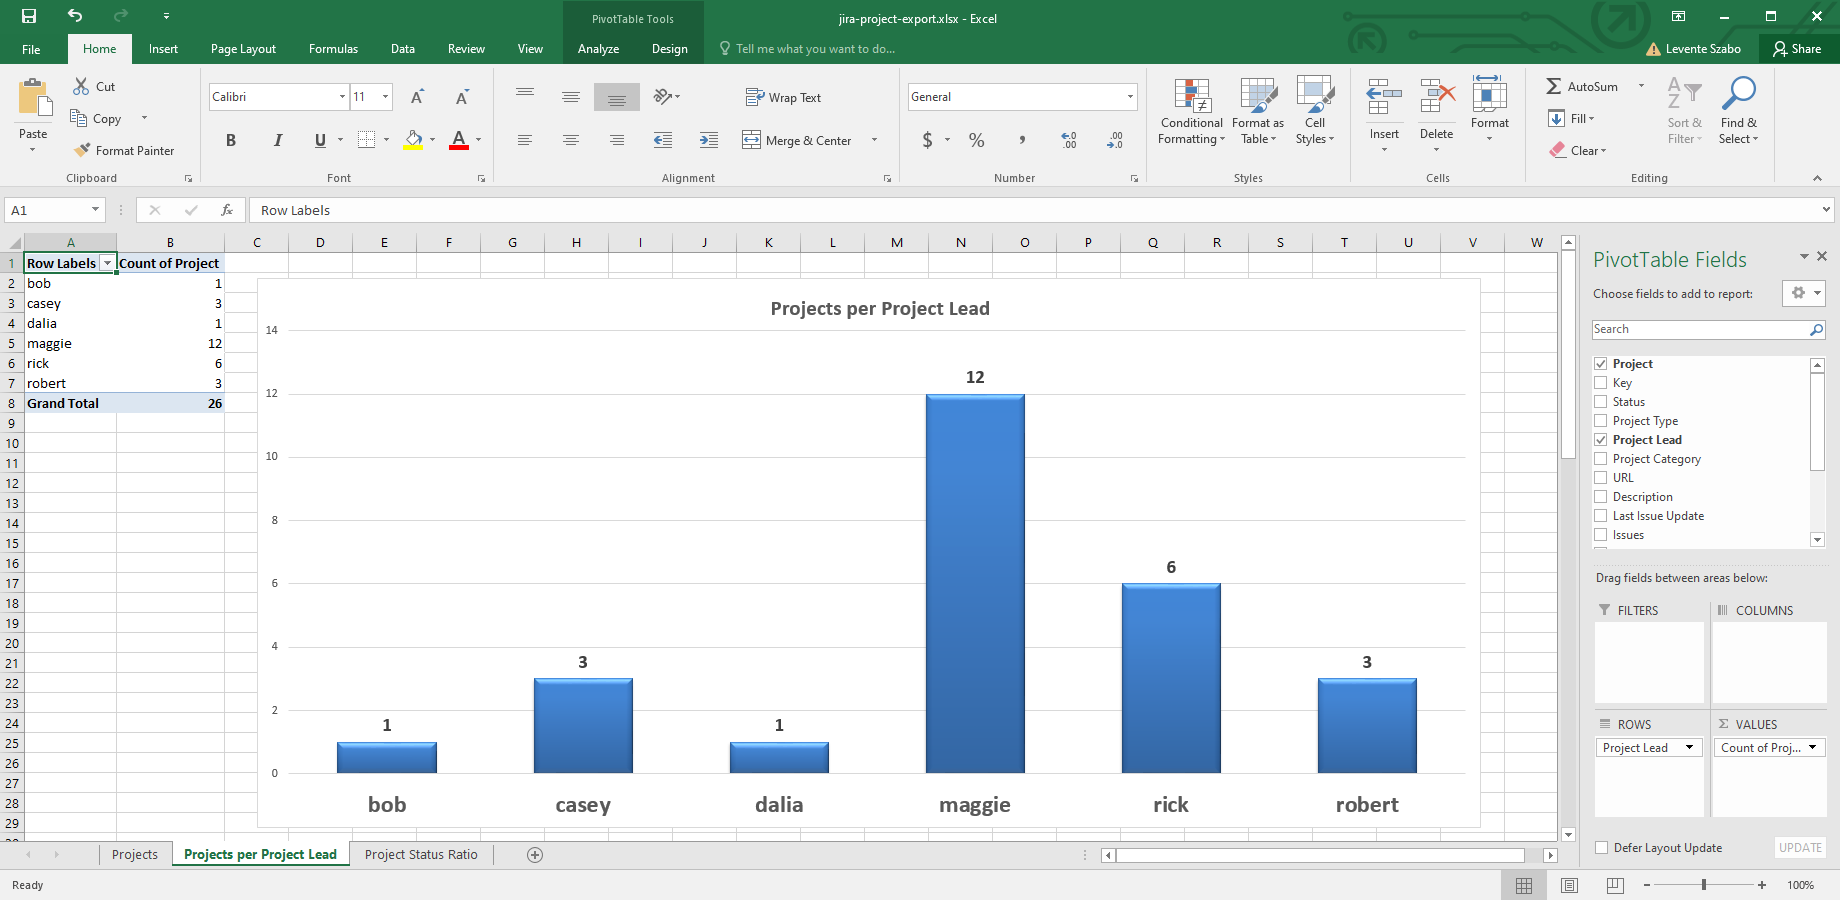
A key attribute of a Jira Cloud project is its lead. The project export template lists the project leads for each project. This makes it easy for you to find the colleagues with the most projects on their plates.
This chart helps you understand if anyone is overburdened with project lead tasks and fix the discovered anomalies.
Create Jira Cloud reports with project statistics now!
