
In this page
Custom Charts integration features
Custom Charts PDF export samples
Agile insights and metrics export
Service excellence dashboard export
Configuration
Troubleshooting
Learn more about Custom Charts
What is Custom Charts?
(supported since Better PDF Exporter 4.7.0)
Custom Charts for Jira is a powerful app that lets you easily create customizable reports, dashboards, graphs, and tables to visualize and share your Jira data.
Custom Charts integration features
- You can export the Custom Charts gadgets to PDF with "full support".
- The following gadgets are supported:
- Custom Charts
- Custom Charts Issue List
- Custom Charts Shared Dashboard
- Custom Charts Simple Search
(Need more features? Tell us in a support ticket!)
Custom Charts PDF export samples
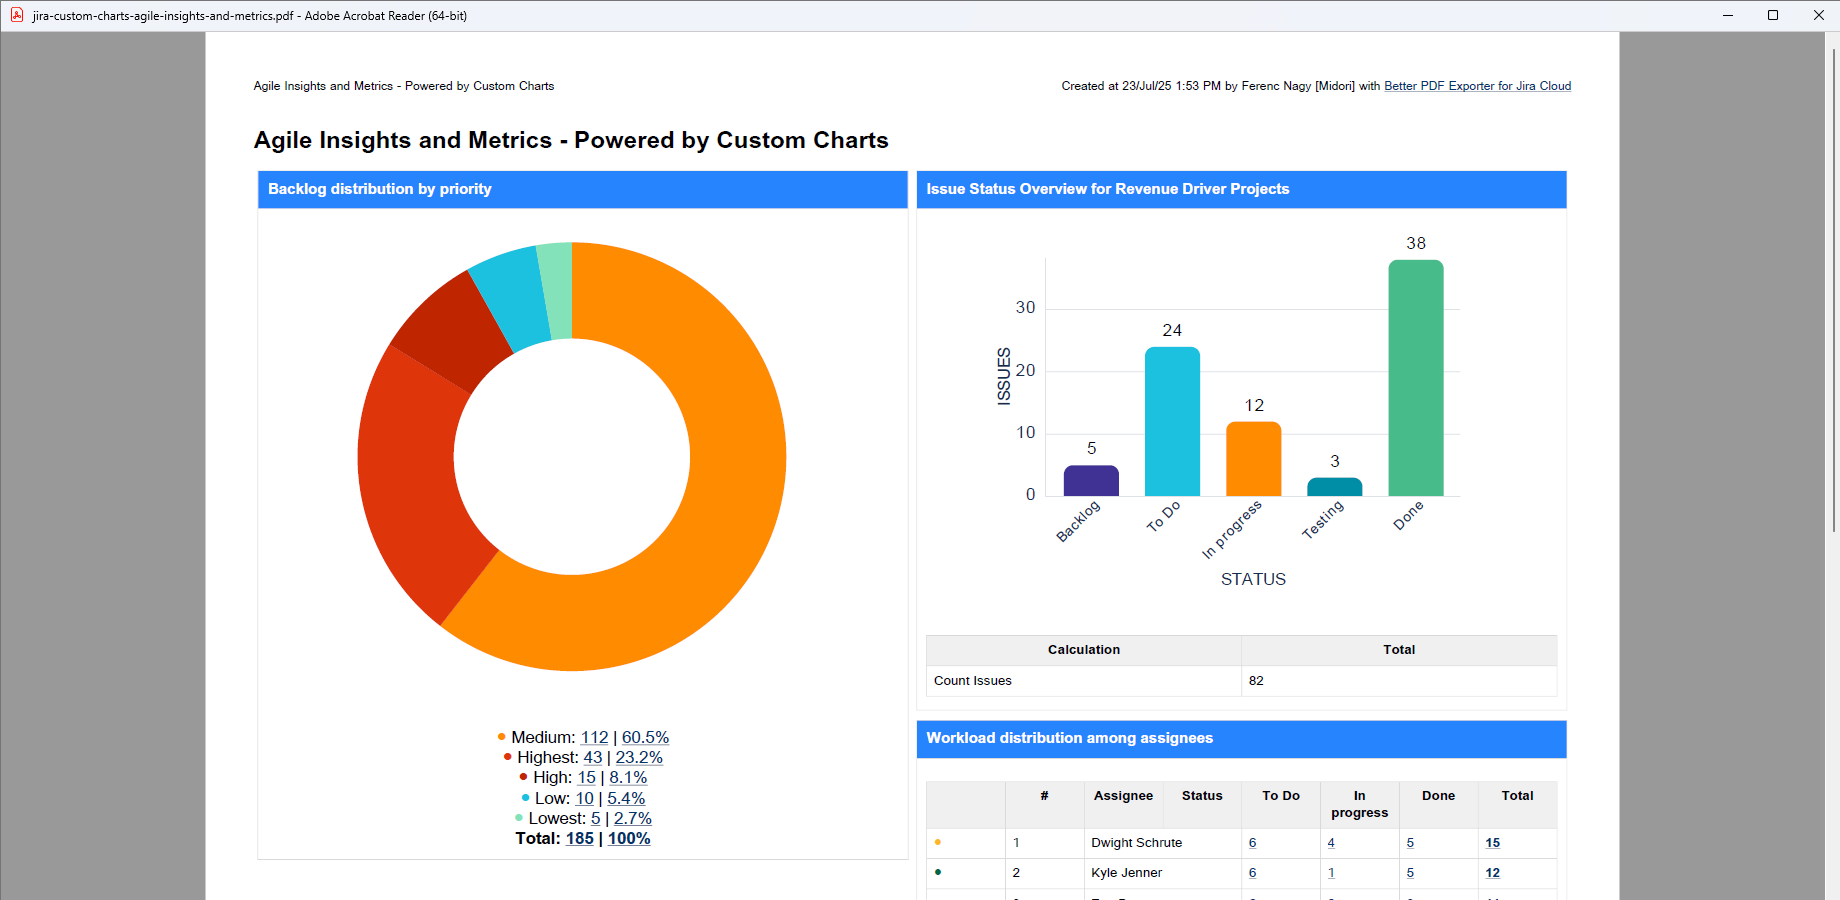
Agile insights and metrics export
Agile insights and metrics dashboard that visualizes backlog priorities, issue statuses, workload distribution, and project health to support agile team performance tracking.
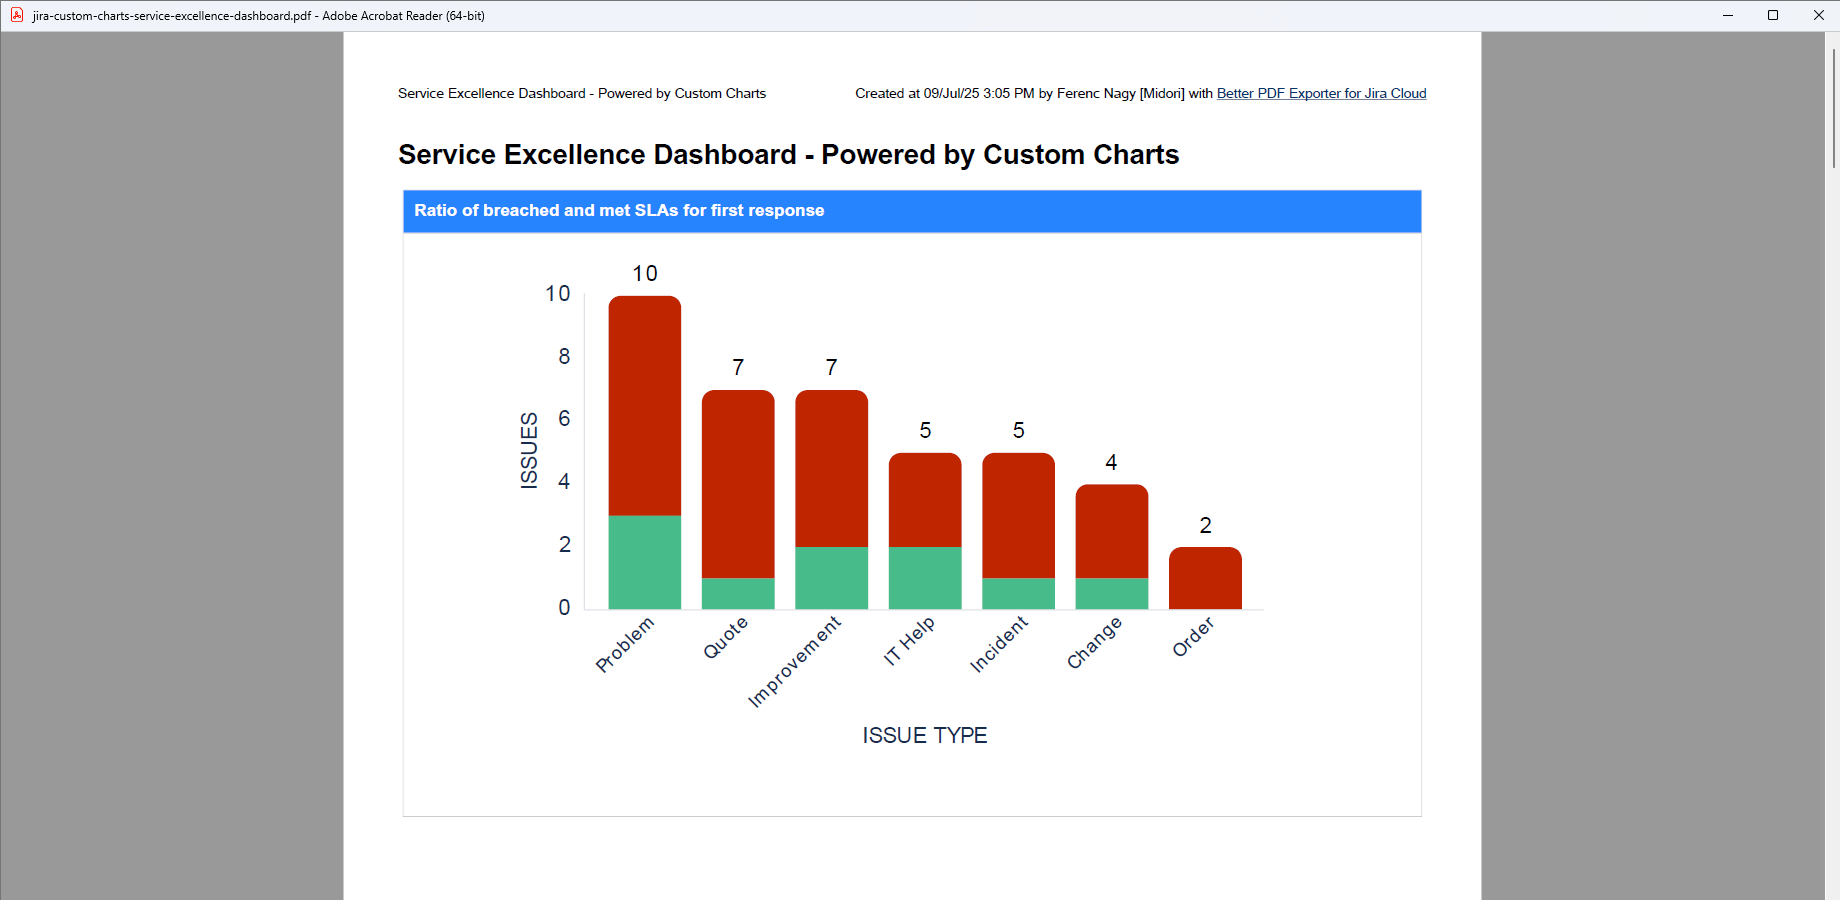
Service excellence dashboard export
Jira Service excellence dashboard that showcases key support metrics like SLA compliance, agent workload, ticket volume by category, and weekly resolution trends. It provides a clear, data-driven snapshot of service performance for operational transparency and continuous improvement.
Configuration
See the generic dashboard customization guide.
Troubleshooting
See the dashboards-related section in the troubleshooting page.
Learn more about Custom Charts
- Custom Charts product information (at its own vendor)
- Custom Charts documentation
- Custom Charts app page (on the Atlassian Marketplace)