
Export Custom Charts gadgets from Jira
Custom Charts for Jira is a powerful reporting app that lets you easily create customizable, interactive charts and dashboards directly in Jira. With an intuitive drag-and-drop interface, it supports pie charts, bar charts, line charts, and more, enabling teams to visualize Jira data in real time without needing JQL expertise. Ideal for agile reporting, empowering users to build tailored reports that suit their workflows.
Next steps
- For the tutorial video and the configuration guide, see the Custom Charts integration page.
- Create similar PDF reports from your own issues with the free 30-day trial!
Export samples
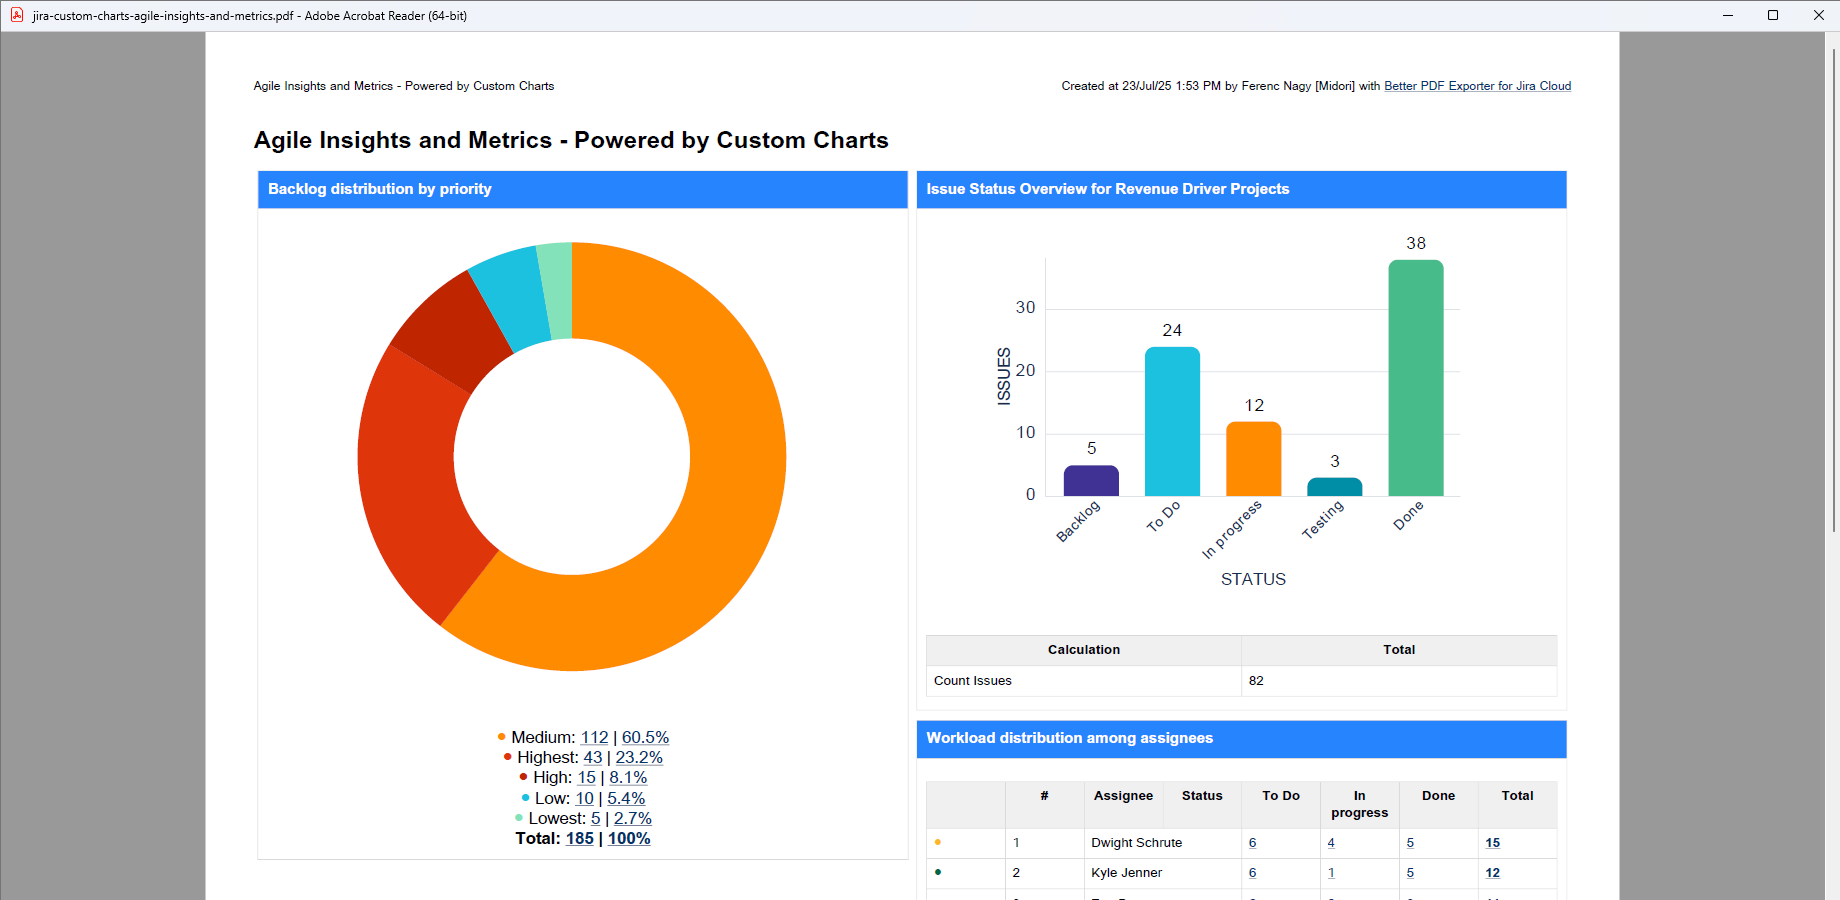
Agile insights and metrics export
Agile insights and metrics dashboard that visualizes backlog priorities, issue statuses, workload distribution, and project health to support agile team performance tracking.
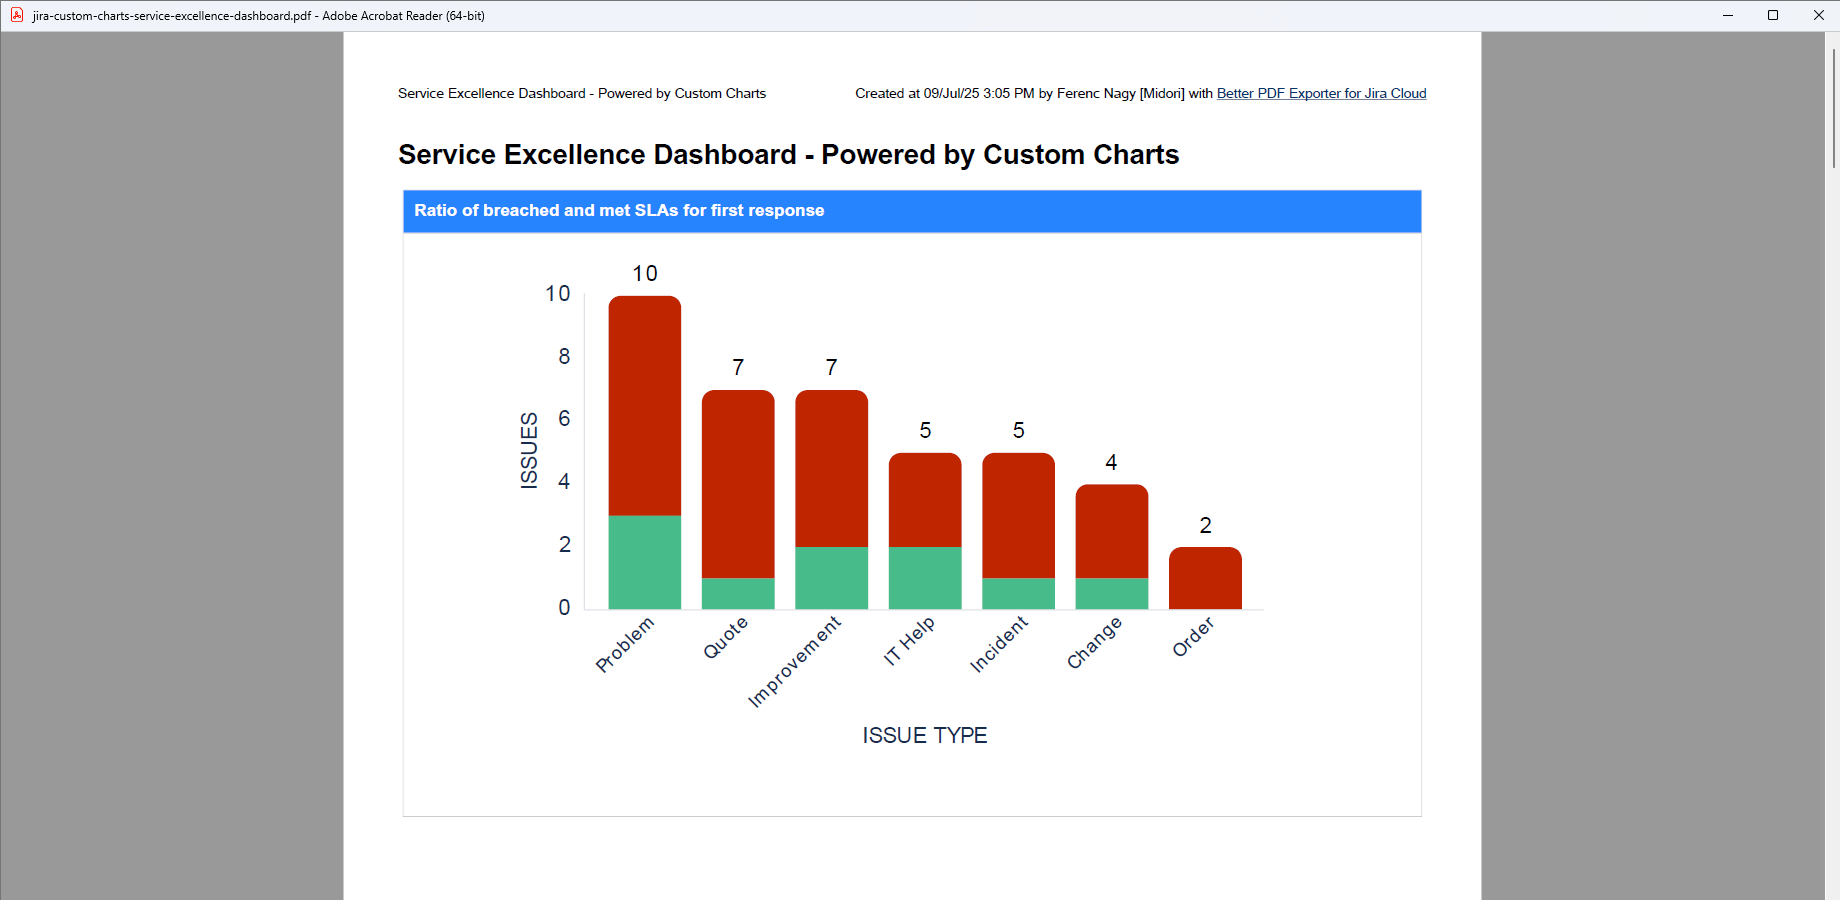
Service excellence dashboard export
Jira Service excellence dashboard that showcases key support metrics like SLA compliance, agent workload, ticket volume by category, and weekly resolution trends. It provides a clear, data-driven snapshot of service performance for operational transparency and continuous improvement.