
Export Created vs. Resolved Excel reports from Jira
The created-vs-resolved-report.xlsx template exports the creation date and the resolution date (both transformed to year, month and day components using Excel functions) plus several issue fields to its last worksheet. Then it displays multiple pivot tables and pivot charts using various combinations of the Jira project key, issue type, status, assignee, etc. fields in the other worksheets.
You can easily clone and customize the Excel template to your needs, by adding, modifying, deleting field values or by adding, modifying, deleting pivot worksheets. The resulted reports are delivered ready-made (no need for further clicks), also working perfectly in automation for periodically updated reporting.
Next steps
- Create similar Excel reports from your own issues with the free 30-day trial!
Export samples
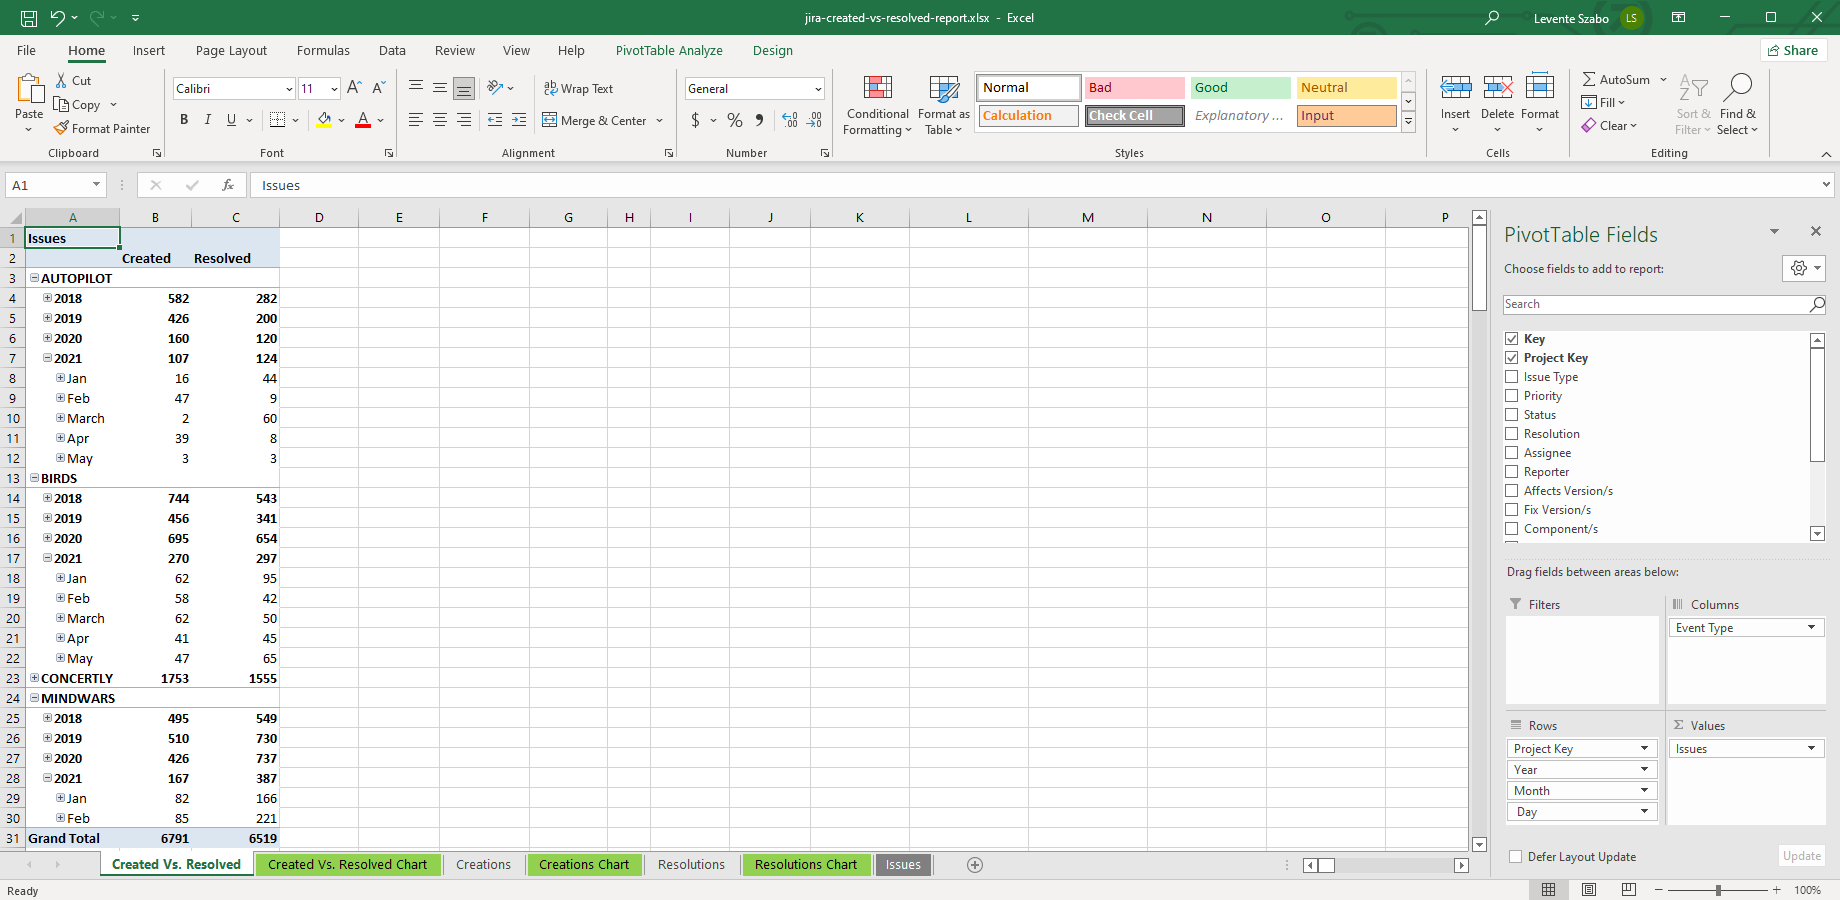
Created vs. Resolved pivot table
This example displays the created vs. resolved counts grouped by project horizontally and grouped by year, month and day vertically. Year, month and day resolution can be expanded / collapsed. Totals are also shown. All these rely on standard Excel features, leveraging the best of Jira and Microsoft Excel.
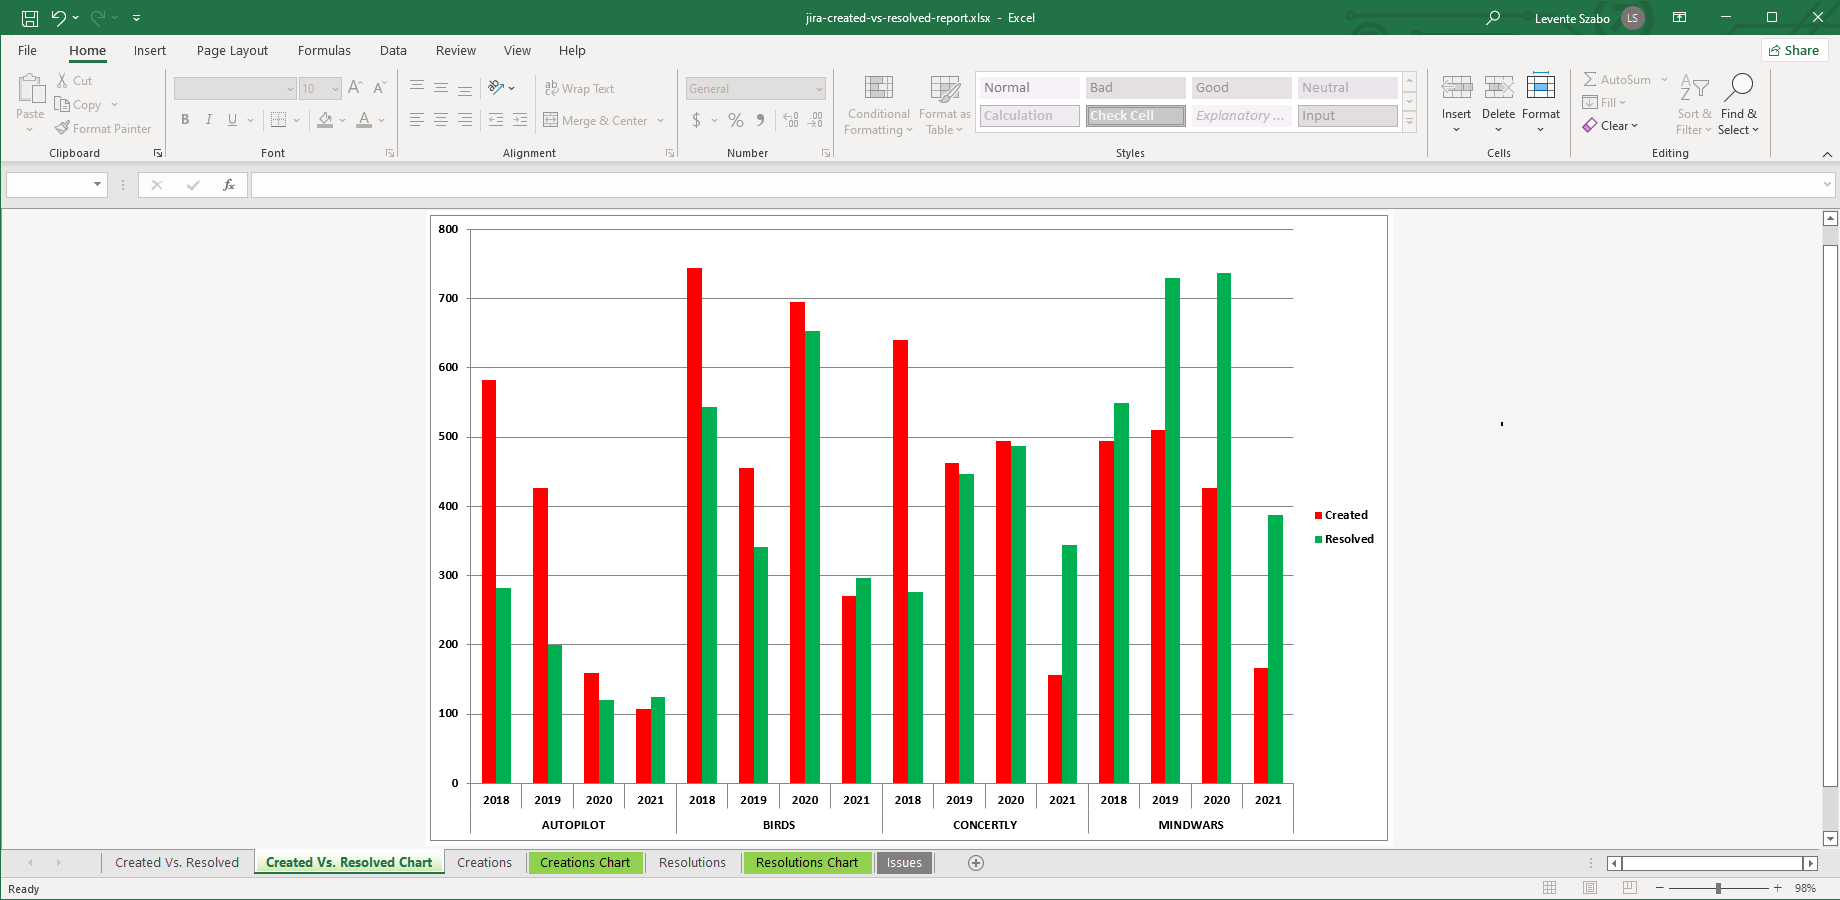
Created vs. Resolved pivot chart
A Jira created vs. resolved chart does a better job at visually communicating trends in the team's productivity. This Excel pivot chart visualizes the created vs. resolved issue counts grouped by projects and years. As for pivot tables, pivot charts also allow you to freely configure its dimensions, grouping or filtering.