
Track time in status with Jira workflow reports
The workflow-report.xlsx template calculates various time metrics from Jira data: Time in Status X (for each status), Time to First Response, Time to Resolution, etc. It also offers average and totals in the form of pivot tables and pivot charts. It enables you understand the lifecycle of your issues and the performance of your team/service.
In addition to customizing the pivot tables and charts, there are many ways to customize the underlying data itself. For instance, you can add your own time metrics by modifying the workflow-report.groovy script. Or, you can add your own SLA formulas like "if priority is Critical and Time to Resolution is less than 4 hours, then the SLA is met, otherwise breached". It's all up to you!
Next steps
- Create similar Excel reports from your own issues with the free 30-day trial!
Export samples
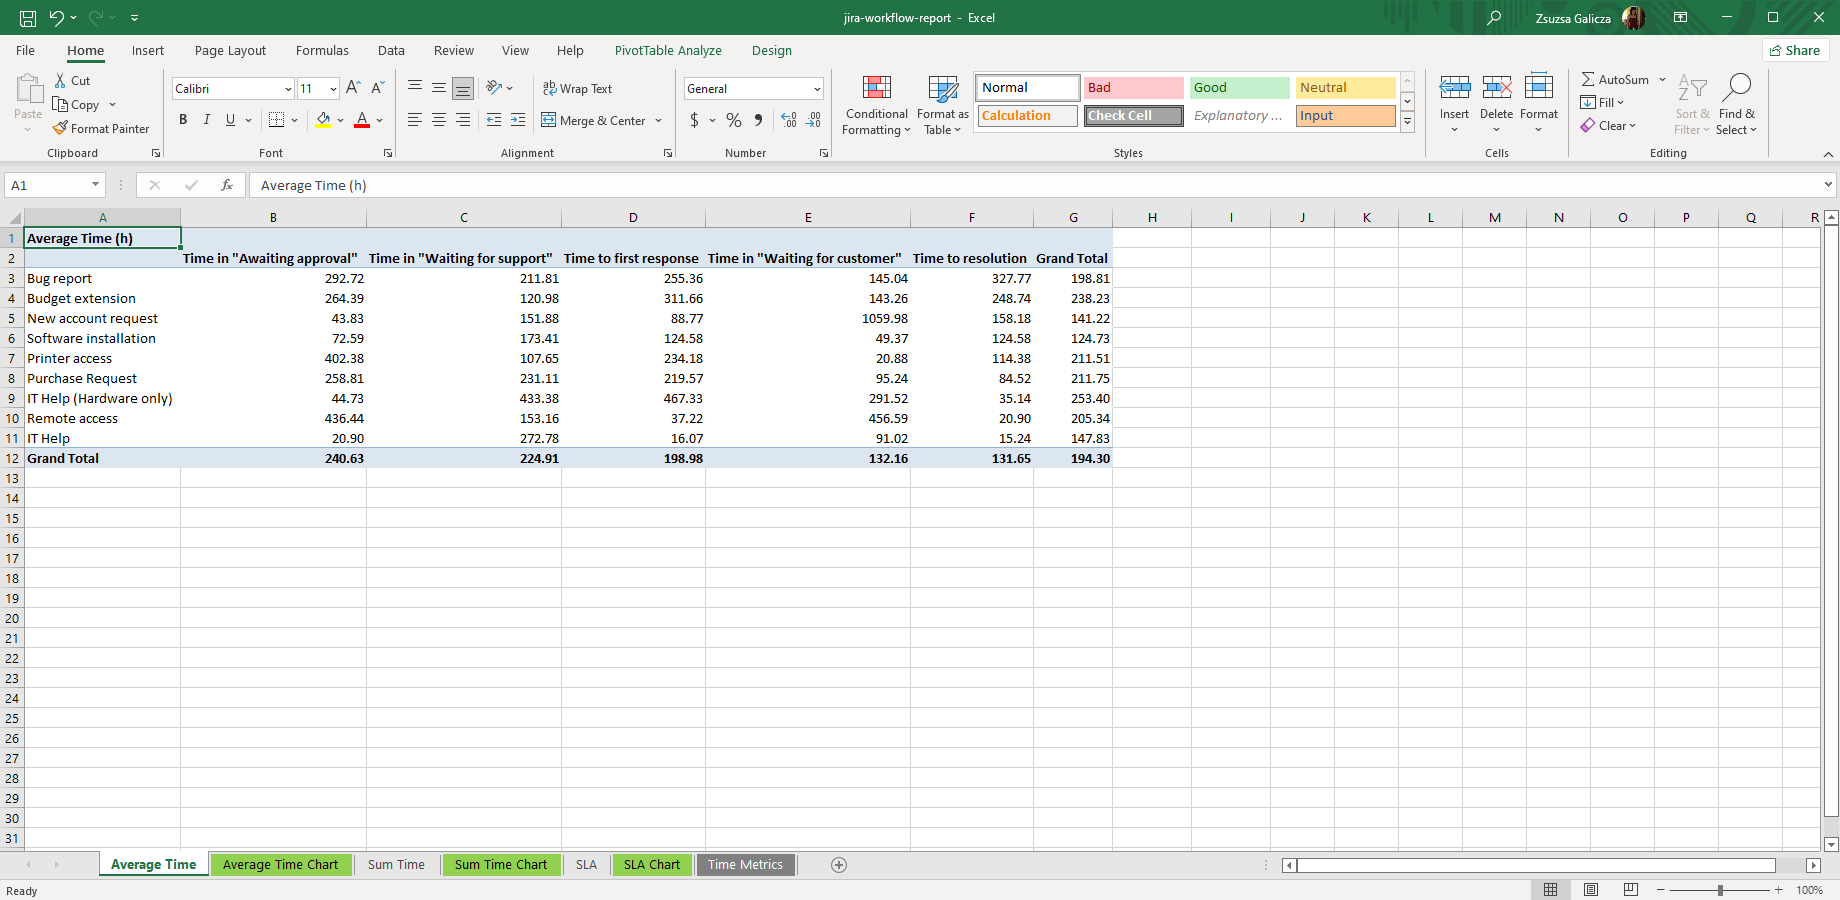
Time in status pivot table
This simplistic Excel example calculates the average time spent of Jira issues in various statuses and the time required for the resolution per issue type. Grand totals are displaying the total averages for both dimensions.
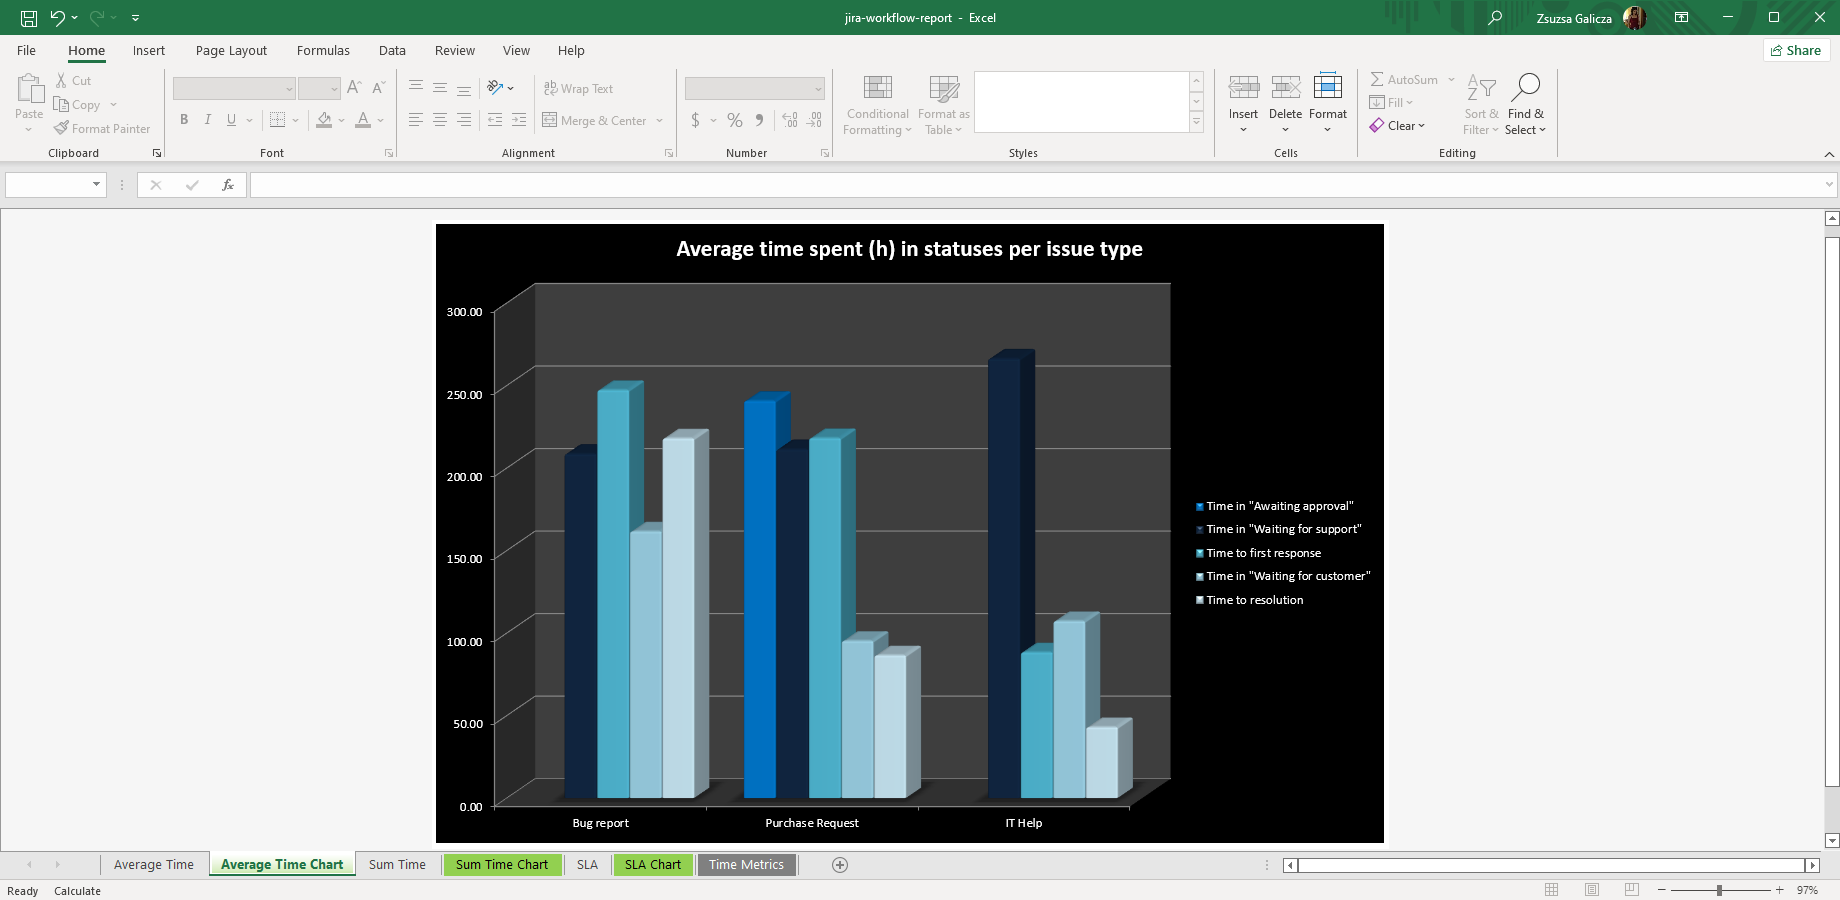
Time in status pivot chart
This is the same example as above, but it shows a more visual Excel feature to track time is status in Jira. This pivot chart makes the numbers in the previous pivot table faster to grasp using a bar-type pivot chart.