
In this page
Scopes
Content Status Overview report for the site
Content Status Overview report for a space
Understand the Content Status Overview report
Work with the Content Status Overview report
Navigate the Content Status Overview report
Filter the Content Status Overview report
Security
What is the Content Status Overview report?
The Content Status Overview dashboard shows the number of pages and blog posts by status and space, helping you quickly identify outdated content. It's the ideal tool for prioritizing updates and rewrites, ensuring your content stays current, relevant, and valuable to users.
Quickly learn how to access and use the Content Status Overview dashboard:

Similar to other dashboards, the Content Status Overview dashboard transforms data on spaces, pages, blogs and users into clear summaries:
- You can view the current status of your pages and blogs in an easy-to-understand table format.
- You can browse the list of pages and blog posts by space and status.
- You can gain insights into the currency, relevance, and accuracy of your content.
- You can effectively report on even thousands of spaces.
Scopes
The Content Status Overview dashboard is available for the whole Confluence site and for any single space.
Content Status Overview report for the site
For the site scope report, expand the Apps section in the left-bar (not Space apps!) → click the Better Content Archiving app → Status overview tab. In this scope, the report covers all spaces, all contents and all activities on the site.
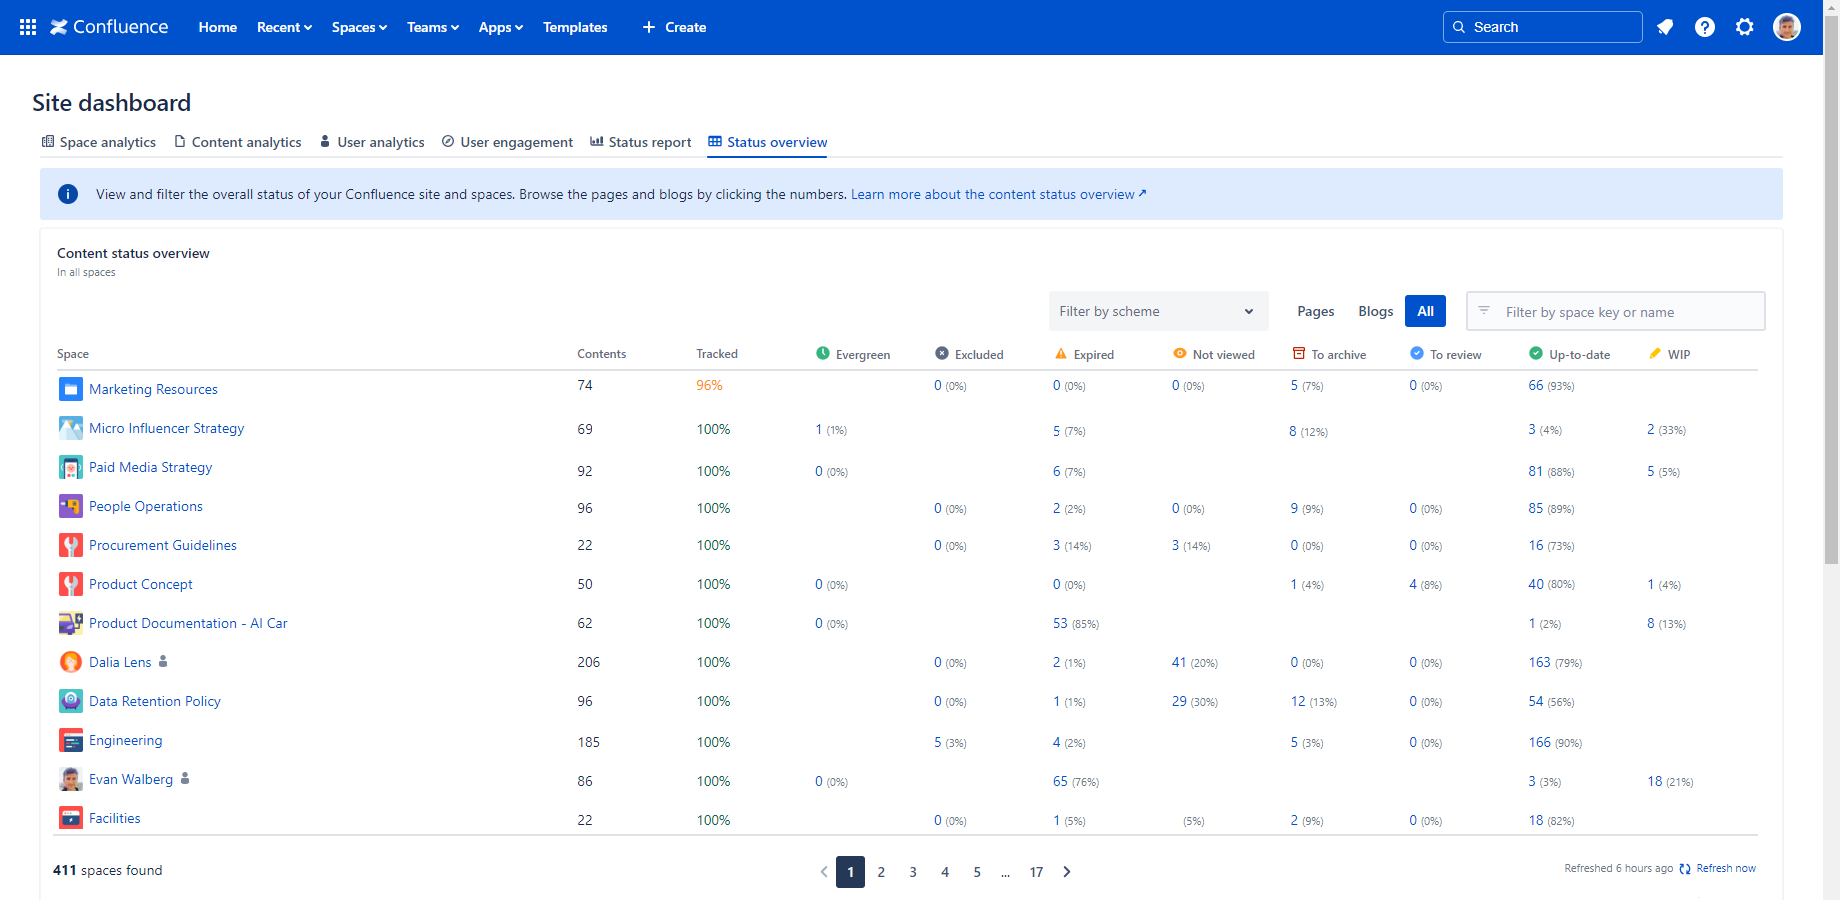
The report displays all statuses that are part of the content status schemes applied to at least one space. When a status is not defined for a space, the corresponding cell is empty.
Content Status Overview report for a space
For the space scope report, go to the space → expand the Space apps section in the left-bar (not Apps!) → click the Better Content Archiving app → Status overview tab. In this scope, the report covers only that single space, the contents and the activities in it.
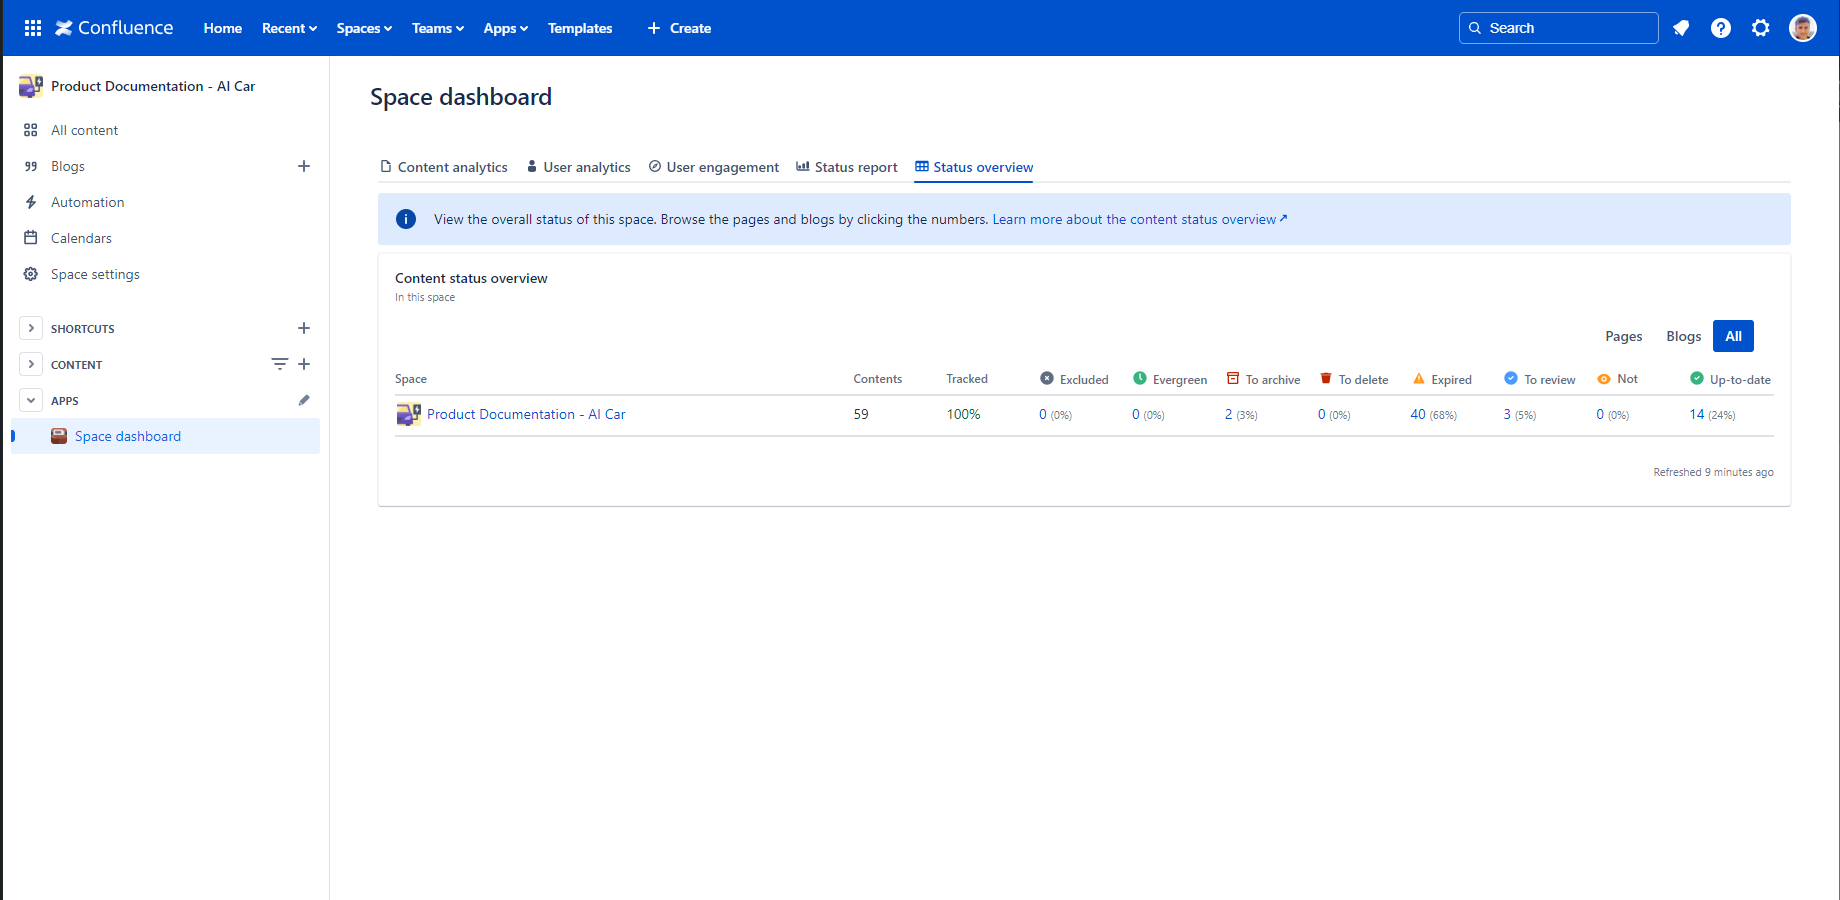
The report displays only those statuses that are added to the content status scheme applied to this space.
Understand the Content Status Overview report
The Content Status Overview dashboard the list of global and personal spaces in the rows. For personal spaces, there is a "person" icon shown after the space name. For global spaces, there is no icon.
The statuses in the columns are defined by the content status schemes selected for the spaces. (When you first install the app, the default content status scheme is selected for every space, and you see metrics calculated based on that.)
The following metrics are displayed in the table:
- Contents: Number of contents (pages, blogs) in the space.
- Tracked: The percentage of all content currently processed by the app. Although it should be 100%, it may be lower if a refresh is due or page restrictions prevent the app from accessing certain contents. ("A refresh is due" when the content status scheme was modified, or the space is newly included in content lifecycle management.)
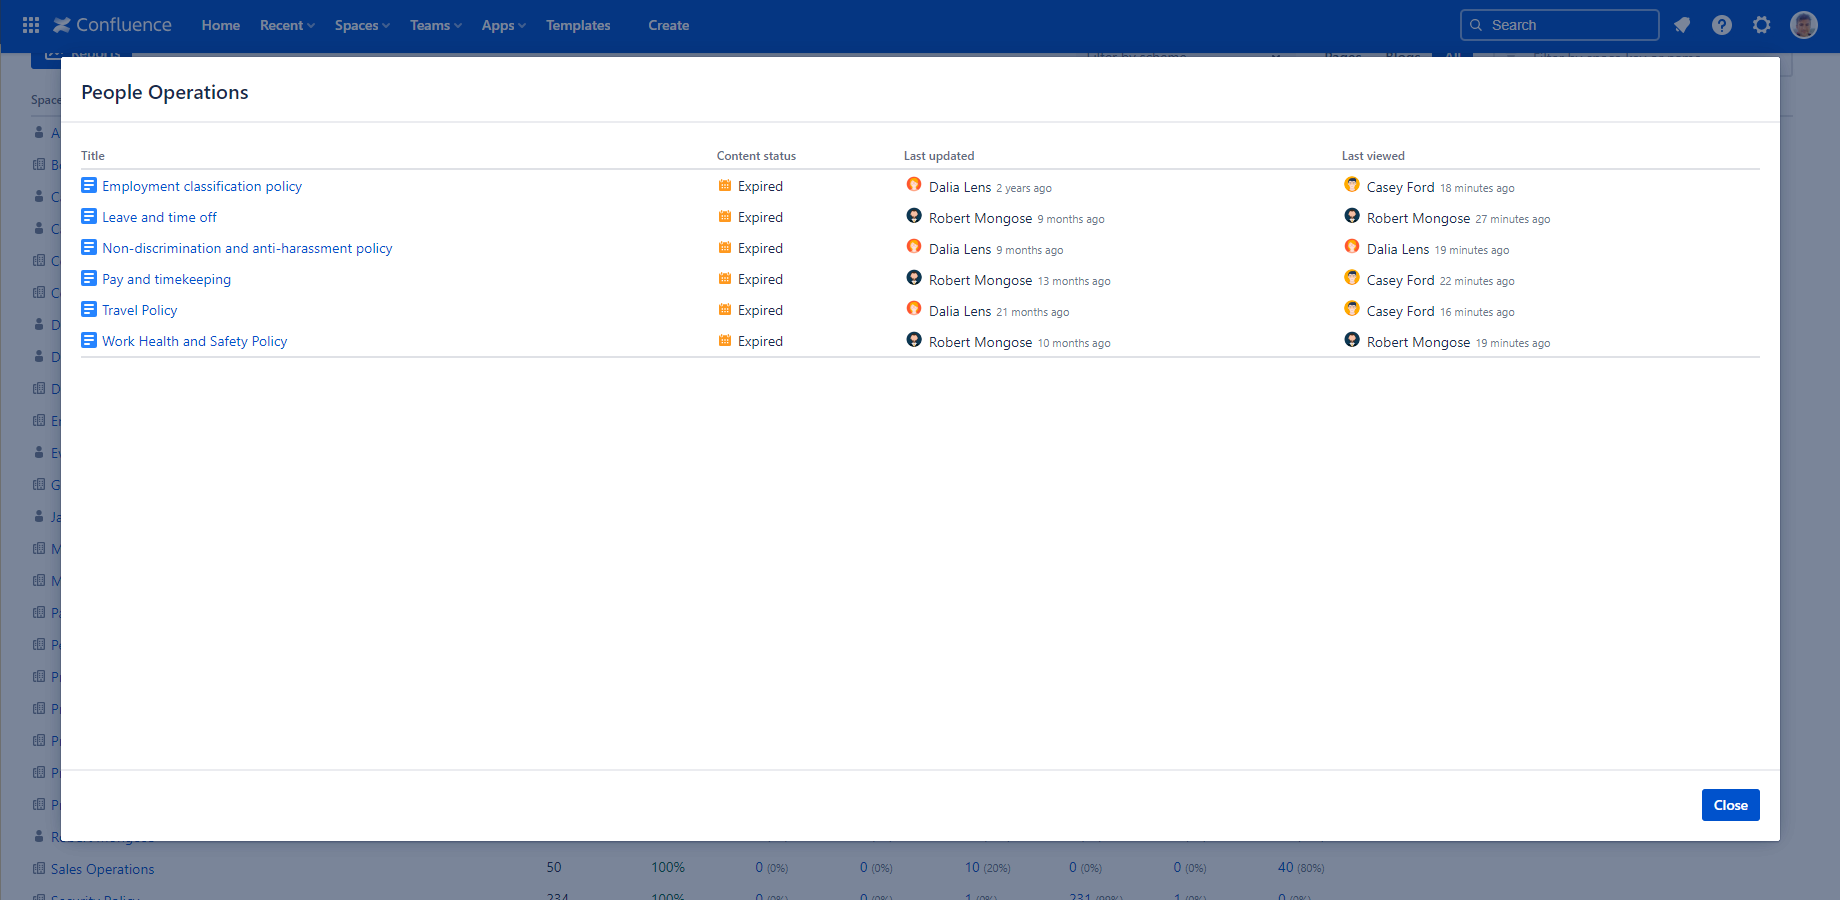
- Status column: Number and percentage of the contents in this status.
You can click on the counts to see the list of the contents in that space and status:
Work with the Content Status Overview report
Navigate the Content Status Overview report
The Content Status Overview dashboard is efficient to use even on large Confluence sites.
If you have a large number of spaces, you can walk through the table using the pager controls at the bottom. A single page contains at most 50 spaces. The spaces are ordered alphabetically by default.
You can see the total number of the spaces at the bottom of the page. When you apply filters, the table itself and the space count will reflect the filtered space list, and the pager will jump to the first page.
Filter the Content Status Overview report
In site scope, you can filter the spaces on the report using the controls above the table. Filtering is useful when you search for one particular space, and also when you want to narrow your view to a subset of spaces.
- You can filter the spaces by the content status scheme and the notification scheme applied to them. If you choose multiple schemes, then all spaces that match at least one selected scheme will be shown.
- You can also filter spaces by their name and keys. If you enter "cust", then all spaces that have this text in their names or keys will be shown.
Finally, there is a 3-state selector to choose whether the metrics should be calculated for pages only, for blog posts only or both.
Security
The Content Status Overview dashboard is available for all users. The dashboard respects the Confluence space permissions and page restrictions.
More precisely:
- If the app can't access a space or content (page or blog post), it will not collect analytics about it.
- If you can't view a space, it will not be listed for you.
- If you can't view a content, it will not contribute to the status counts. Also, it won't show up in the content list for that status.
As the dashboard is personalized for the user who opens it, your dashboard view and your teammate's may be different.
Questions?
Ask us any time.