
In this page
Scopes
User Engagement report for the site
User Engagement report for a space
Understand the User Engagement report
Activities
Views
Updates
New contents
Status changes
Content views
Content updates
Content creations
Content status changes
Security
What is the User Engagement report?
The User Engagement dashboard provides key performance indicators (KPIs) and insights into how frequently users interact with your Confluence site or within specific spaces. It helps you assess whether users are actively engaging with the content and deriving real value from it, giving you a clear understanding of how your content resonates with its audience.
Quickly learn how to access and use the User Engagement dashboard:

Similar to other dashboards, the User Engagement dashboard transforms data on spaces, pages, blogs and users into clear summaries:
- You can gain insights about your users and their level of engagement.
- You can view the number of the content views, updates, creations and status changes on the site or in the space.
- You can view the trends of the content views, updates, creations and status changes on the site or in the space.
Scopes
The User Engagement dashboard is available for the whole Confluence site and for any single space.
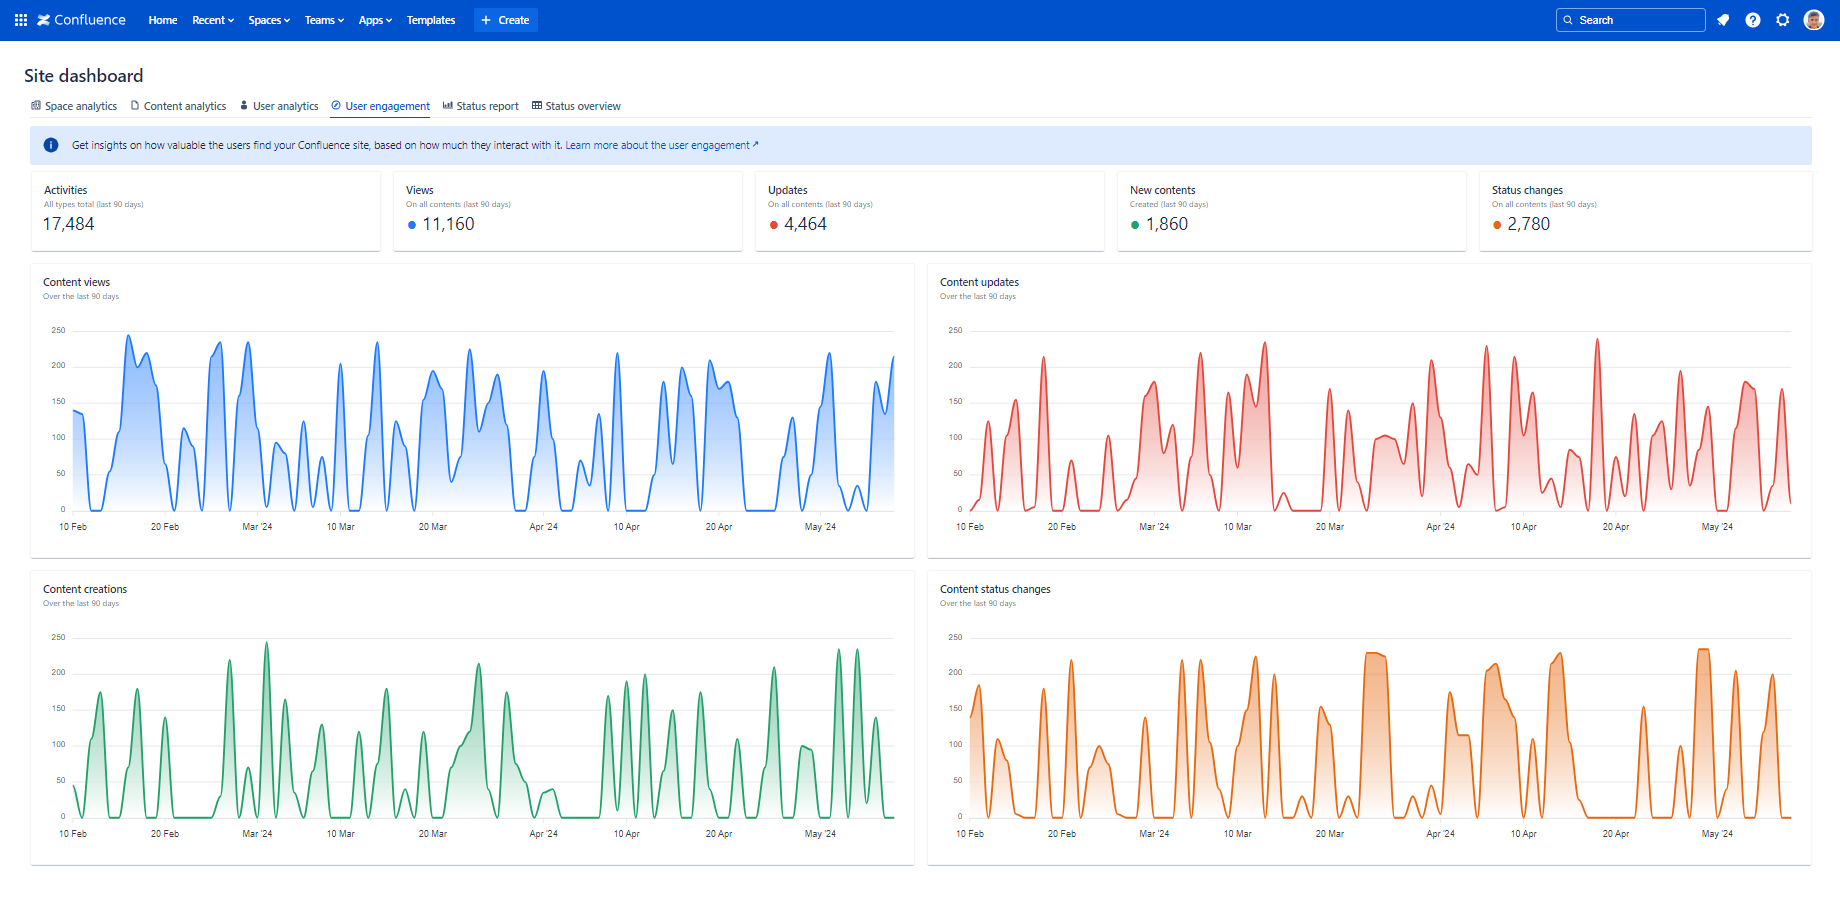
User Engagement report for the site
For the site scope report, expand the Apps section in the left-bar (not Space apps!) → click the Better Content Archiving app → User engagement tab. In this scope, the report covers all spaces, all contents and all activities on the site.
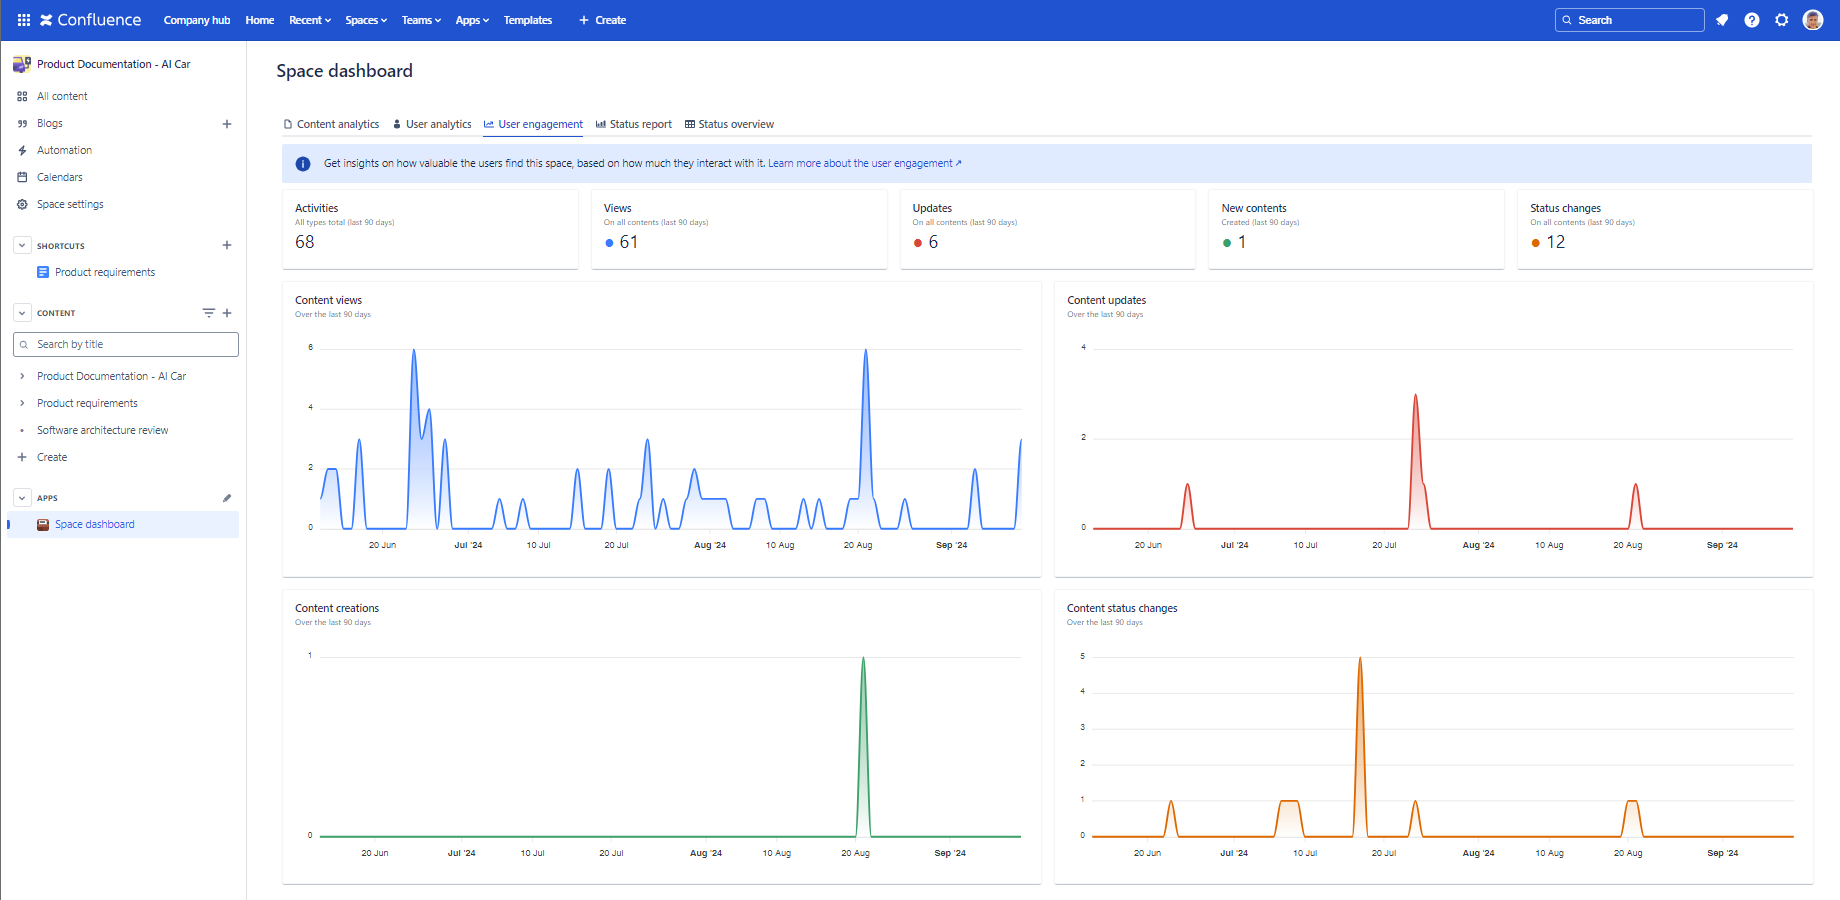
User Engagement report for a space
For the space scope report, go to the space → expand the Space apps section in the left-bar (not Apps!) → click the Better Content Archiving app → User engagement tab. In this scope, the report covers only that single space, the contents and the activities in it.
Understand the User Engagement report
The following section helps you understand the User analytics report by explaining each gadget.
| Gadget | Description | Notes |
|---|---|---|
| Activities |
Displays the total number of user activities in the last 90 days on the Confluence site or in the space.
This KPI effectively measures the "engagement rate" there. (It is the total of content views, updates and creations.) |
A low number of activities may indicate that the site or the space may be abandoned. Consider reactivating users to improve content lifecycle management efficiency, or removing their accounts to reduce Confluence subscription costs. |
| Views | Displays the number of times when a page or blog post was viewed in the last 90 days. This KPI effectively measures the user interest in the content. | A low number of content views may indicate that the site or space is not actively used. Consider archiving the unused spaces to reduce clutter. |
| Updates | Displays the number of times when a page or blog post was updated in the last 90 days. This KPI effectively measures how frequently users "refresh" the content to keep it up-to-date. | A low number of content updates may indicate that the content is outdated. Consider implementing a periodic review workflow to encourage users to update the content regularly. |
| New contents | Displays the number of times when a new page or blog post was created in the last 90 days. This KPI effectively measures the content growth and the related development efforts. | |
| Status changes |
Displays the number of times when a page or blog post changed its content status.
This KPI effectively measures the progression through different stages in the content lifecycle. (It includes changes from any old status to any new status, such as from "Expired" to "Up-to-date" or from "In review" to "Approved".) |
|
| Content views |
The line chart shows how the number of content views fluctuates over time.
Hovering over the chart will reveal the number of views on any given day. (There is one data point per day.) |
A decreasing trend in views may suggest that the content is becoming less relevant. Consider archiving the unused pages and blog posts to help reduce clutter. |
| Content updates |
The line chart shows how the number of content updates fluctuates over time.
Hovering over the chart will reveal the number of updates on any given day. (There is one data point per day.) |
A decreasing trend in updates may suggest that the content is becoming less accurate (or it is reaching maturity and there are no more updates required). Consider implementing a periodic review workflow to encourage users to update the content regularly. |
| Content creations |
The line chart shows how the number of content creations fluctuates over time.
Hovering over the chart will reveal the number of creations on any given day. (There is one data point per day.) |
|
| Content status changes |
The line chart shows how the number of content status changes fluctuates over time.
Hovering over the chart will reveal the number of status changes on any given day. (There is one data point per day.) |
A positive trend in status changes may suggest that the content lifecycle is managed efficiently. |
Security
The User Engagement dashboard is available for all users. The dashboard respects the Confluence space permissions and page restrictions.
More precisely:
- If the app can't access a space or content (page or blog post), it will not collect analytics about it.
- Even if you can't view a content, it will contribute to the "action-type" analytics (like Views).
As the dashboard is personalized for the user who opens it, your dashboard view and your teammate's may be different.
Questions?
Ask us any time.