
In this page
Scopes
Content Analytics report for the site
Content Analytics report for a space
Understand the Content Analytics report
Contents
Pages
Blog posts
Viewed contents
Updated contents
New contents
Most popular contents
Fastest changing contents
Security
What is the Content Analytics report?
The Content Analytics dashboard provides detailed KPIs and insights for your Confluence pages and blog posts. It enables you to track performance, uncover trends, and identify top-performing content, whether across your entire site or within specific spaces. With this tool, you can easily monitor effectiveness and make informed decisions to improve content quality.
Quickly learn how to access and use the Content Analytics dashboard:

Similar to other dashboards, the Content Analytics dashboard transforms data on spaces, pages, blogs and users into clear summaries:
- You can gain insights about the performance of your pages and blog posts.
- You can view the number of the pages and blog posts on the site or in the space.
- You can view the number of the pages and blog posts actively viewed and updated.
- You can view the top list of the most viewed and most updated pages and blog posts.
Scopes
The Content Analytics dashboard is available for the whole Confluence site and for any single space.
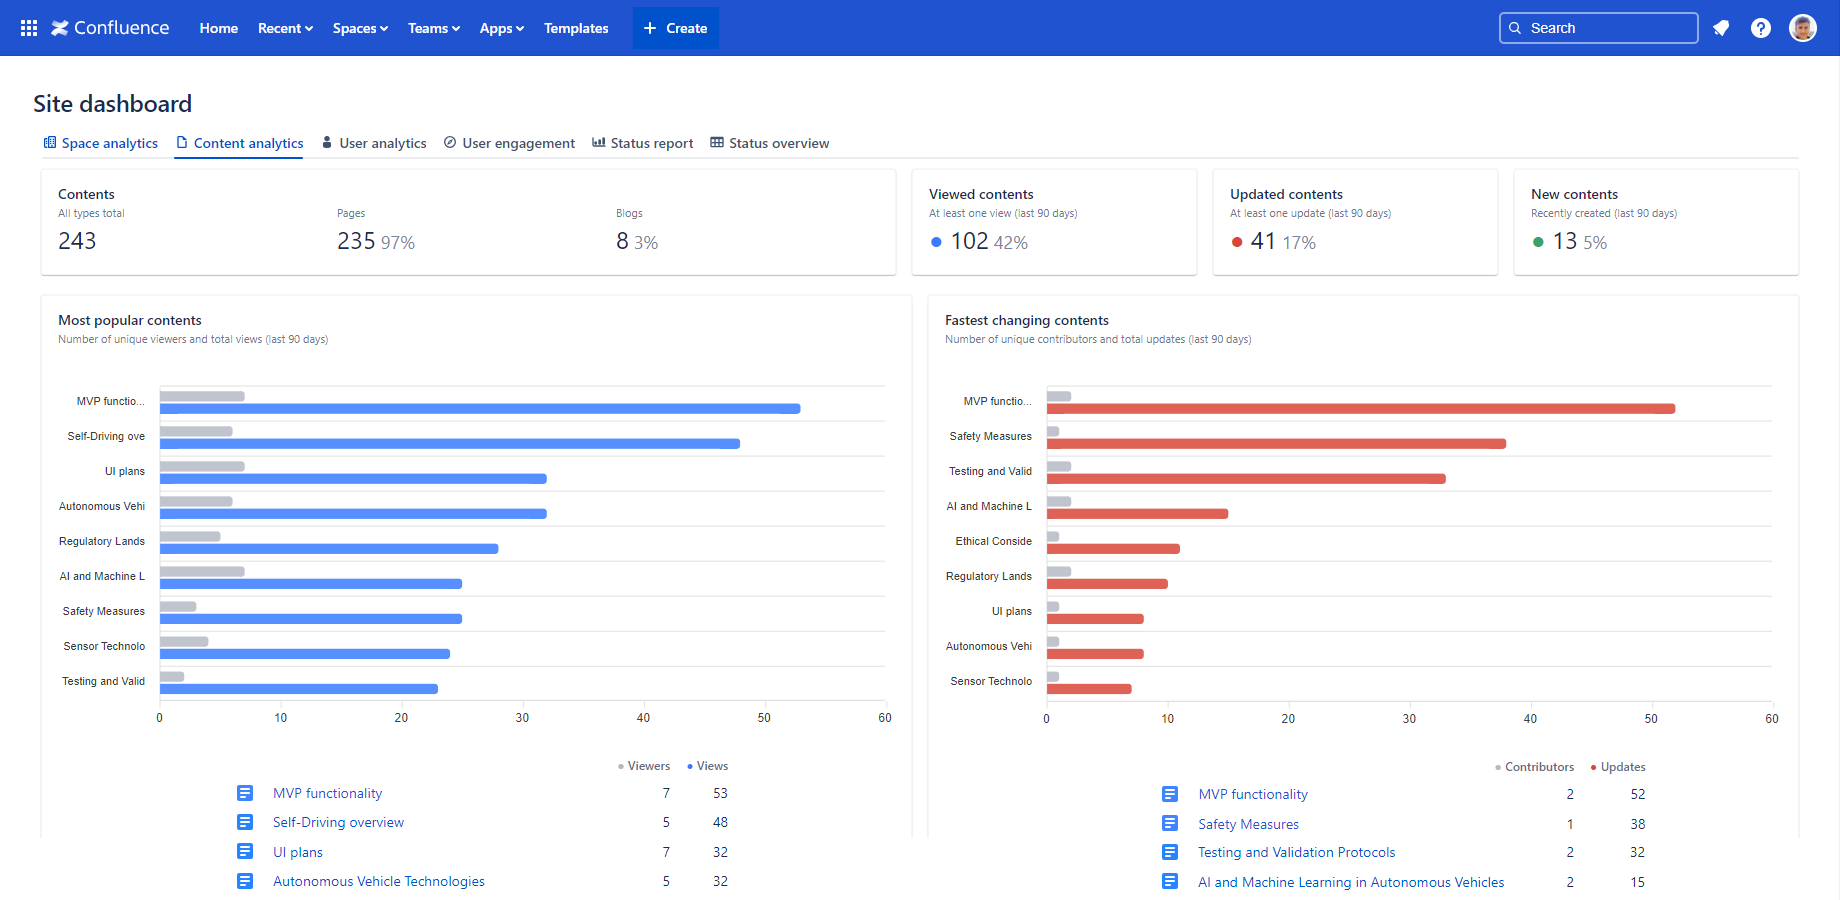
Content Analytics report for the site
For the site scope report, expand the Apps section in the left-bar (not Space apps!) → click the Better Content Archiving app → Content analytics tab. In this scope, the report covers all spaces, all contents and all activities on the site.
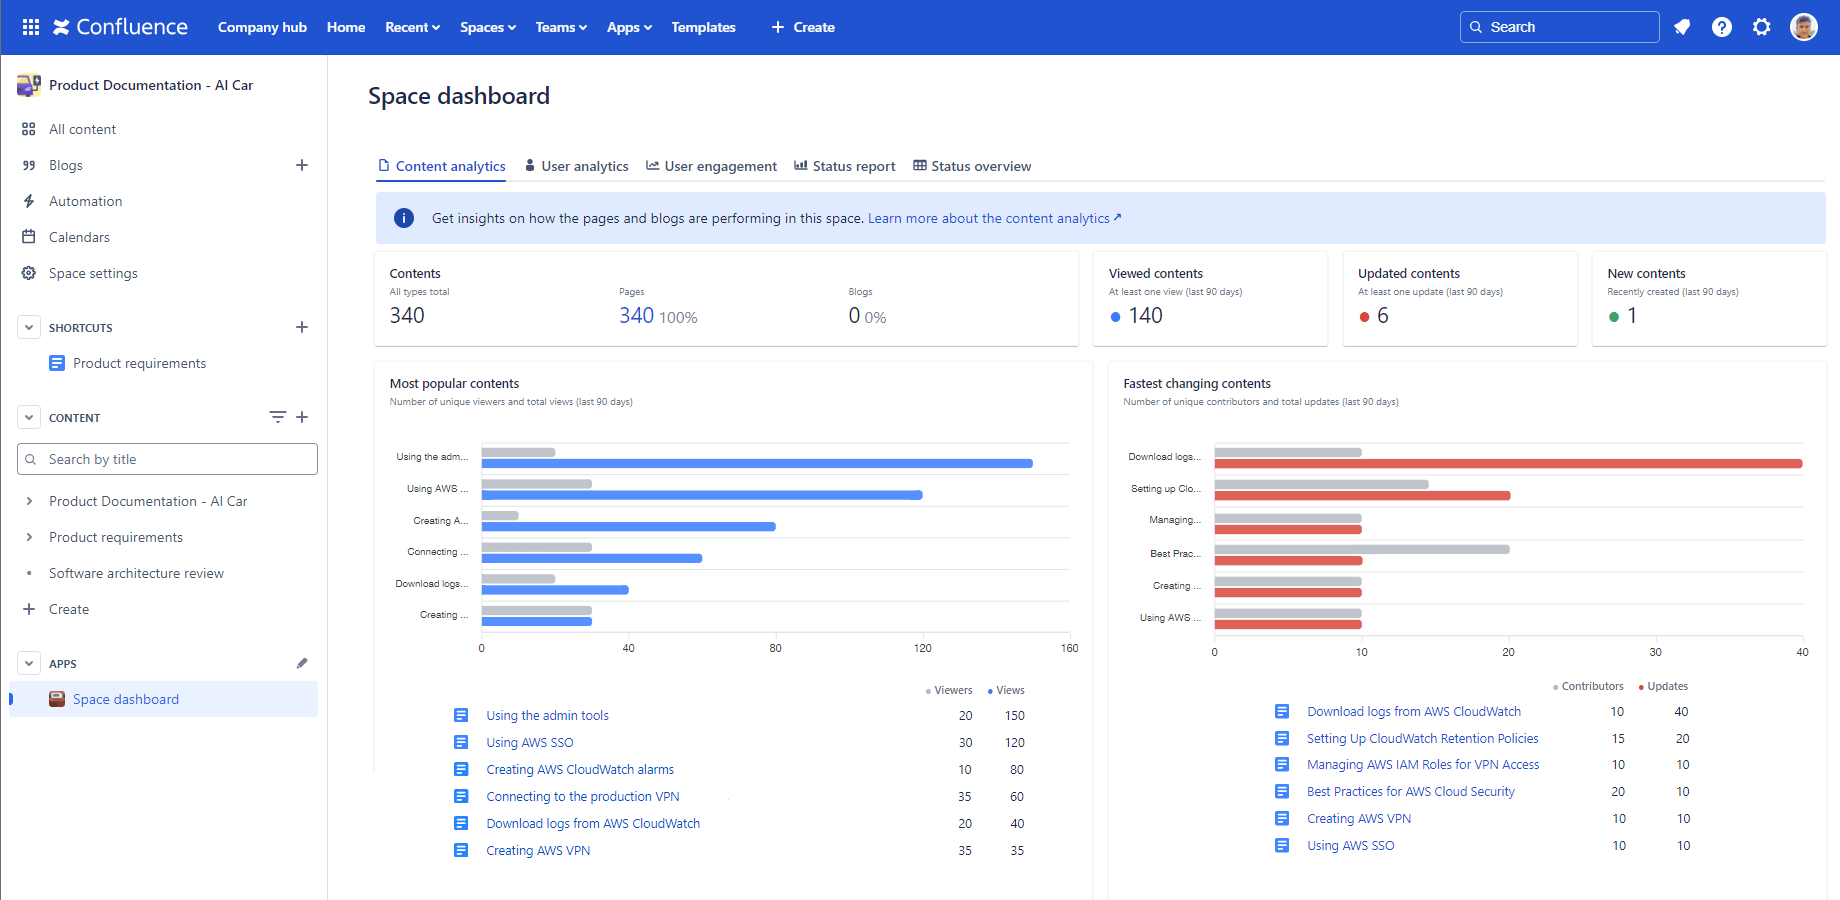
Content Analytics report for a space
For the space scope report, go to the space → expand the Space apps section in the left-bar (not Apps!) → click the Better Content Archiving app → Content analytics tab. In this scope, the report covers only that single space, the contents and the activities in it.
Understand the Content Analytics report
The following section helps you understand the Content analytics report by explaining each gadget.
| Gadget | Description | Notes |
|---|---|---|
| Contents |
Displays the total number of contents on the Confluence site or in the space. (It includes pages, blog posts and all other types of content.) |
|
| Pages | Displays the number and percentage of pages. | |
| Blog posts | Displays the number and percentage of blog posts. | |
| Viewed contents | Displays the number and percentage of the contents (pages and blog posts) which were viewed at least once in the last 90 days. This KPI effectively measures the contents in active use. | A low percentage indicates that there are many pages or blog posts that no longer receive views. Consider archiving the unused pages and blog posts to help reduce clutter. |
| Updated contents | Displays the number and percentage of the contents (pages and blog posts) which were updated at least once in the last 90 days. This KPI effectively measures the contents under active maintenance. | A low percentage indicates that there are many pages or blog posts with possibly outdated content. Consider implementing a periodic review workflow to encourage users to update the content regularly. |
| New contents | Displays the number and percentage of the contents (pages and blog posts) which were created in the last 90 days. This KPI effectively measures the new information added. | A low percentage indicates that your site is mostly in "maintenance mode", with little new content being added. It may be acceptable if the Updated contents KPI is high at the same time. |
| Most popular contents |
Displays the contents (page or blog post) which users viewed the most times in the last 90 days. Displays these metrics for each content, sorted by Views:
|
To improve Confluence content quality, focus on the most popular pages as they are prime candidates. Take a closer look at the per-page analytics for a clearer understanding of activities. |
| Fastest changing contents |
Displays the contents (page or blog post) which users updated the most times in the last 90 days. Displays these metrics for each content, sorted by Updates:
|
If a page is among the fastest changing ones but lacks a clear reason for frequent updates, consult with the page owners to ensure changes don't spiral out of control. |
Security
The Content Analytics dashboard is available for all users. The dashboard respects the Confluence space permissions and page restrictions.
More precisely:
- If the app can't access a space or content (page or blog post), it will not collect analytics about it.
- Even if you can't view a content, it will contribute to the "total-type" analytics (like Viewed contents).
- If you can't view a content, it will be listed as "Undisclosed" for you. Also, its analytics will be hidden.
As the dashboard is personalized for the user who opens it, your dashboard view and your teammate's may be different.
Questions?
Ask us any time.