
In this page
Scopes
Space Analytics report for the site
Space Analytics report for a space
Understand the Space Analytics report
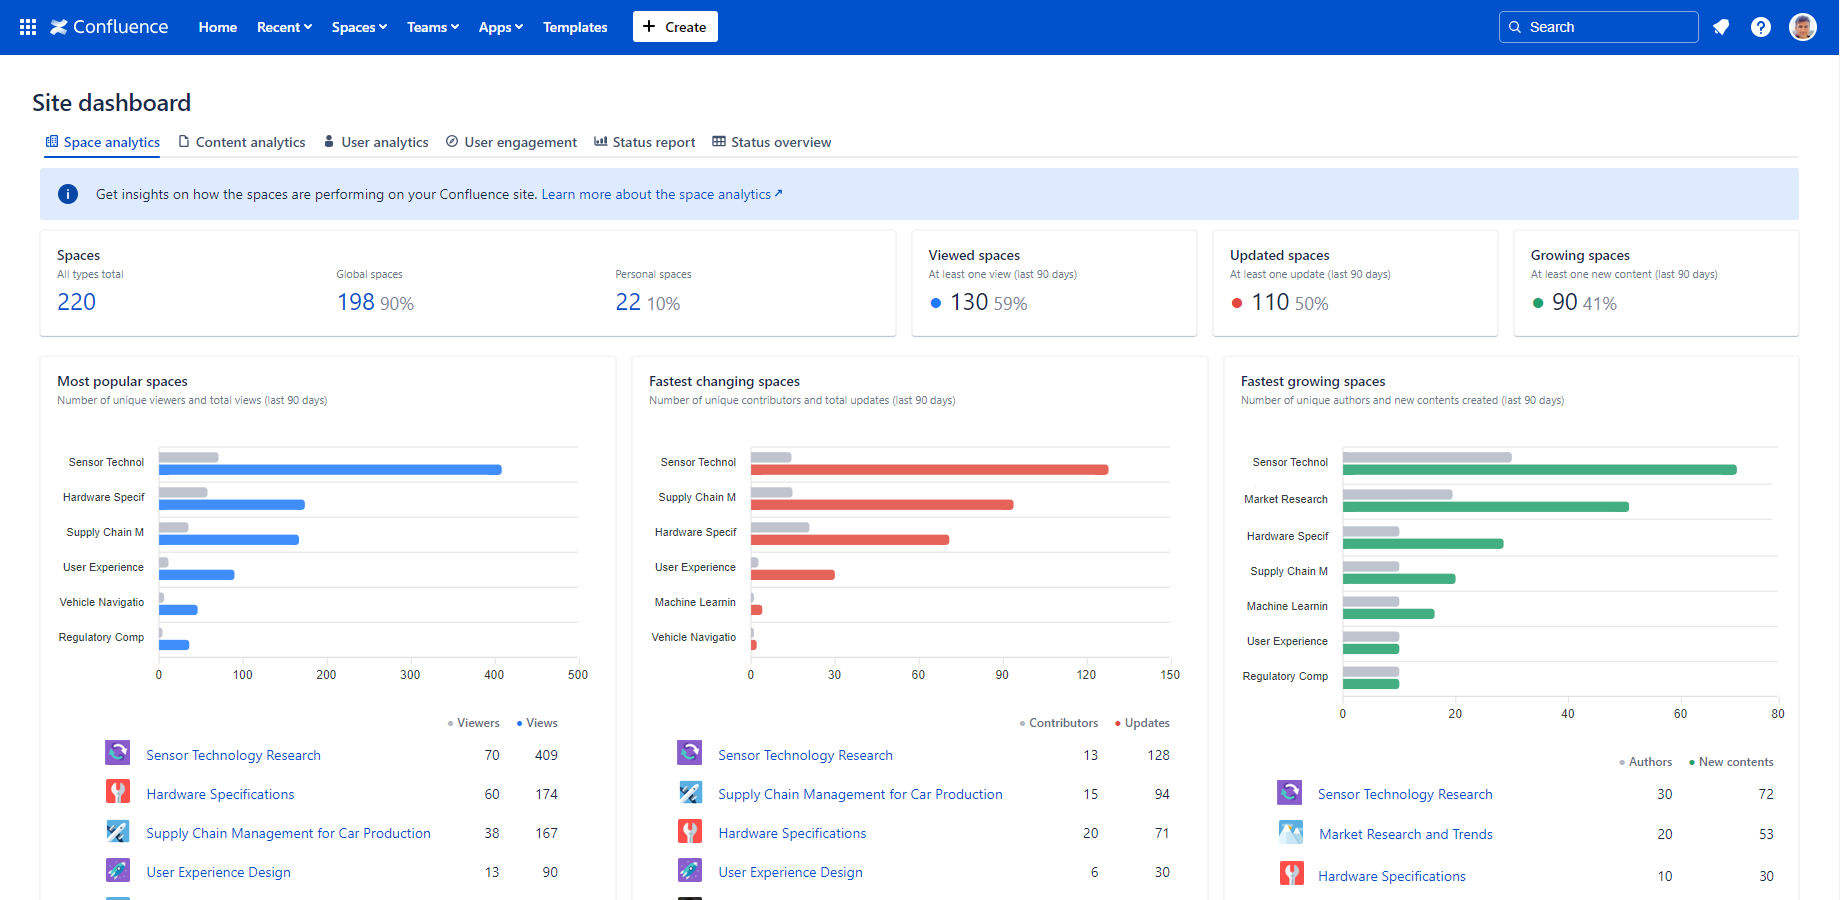
Spaces
Global spaces
Personal spaces
Viewed spaces
Updated spaces
Growing spaces
Most popular spaces
Fastest changing spaces
Fastest growing spaces
Security
What is the Space Analytics report?
The Space Analytics dashboard provides a comprehensive view of key performance indicators (KPIs) and in-depth analytics for all your Confluence spaces. With this centralized tool, you can easily track, monitor, and assess the performance of each space in real time. Stay informed and make data-driven decisions with a clear, organized display of your spaces' metrics in one place.
Quickly learn how to access and use the Space Analytics dashboard:

Similar to other dashboards, the Space Analytics dashboard transforms data on spaces, pages, blogs and users into clear summaries:
- You can gain insights about the performance of your spaces.
- You can view the number of the global and personal spaces on the site.
- You can view the number of the spaces actively viewed, updated and developed.
- You can view the top list of the most actively viewed, updated and developed spaces.
Scopes
The Space Analytics dashboard is available for the whole Confluence site only, for obvious reasons.
Space Analytics report for the site
For the site scope report, expand the Apps section in the left-bar (not Space apps!) → click the Better Content Archiving app → Space analytics tab. In this scope, the report covers all spaces, all contents and all activities on the site.
Space Analytics report for a space
The Space Analytics report is not available for a single space.
Understand the Space Analytics report
The following section helps you understand the Space analytics report by explaining each gadget.
| Gadget | Description | Notes |
|---|---|---|
| Spaces |
Displays the total number of spaces on the Confluence site. (It includes both global and personal spaces.) |
|
| Global spaces |
Displays the number and percentage of global spaces. (These are also known as "communal", "team", "shared" spaces.) |
|
| Personal spaces |
Displays the number and percentage of personal spaces. (It can be a large number because personal spaces are automatically created for all users.) |
|
| Viewed spaces | Displays the number and percentage of the spaces in which at least one content (page or blog post) was viewed in the last 90 days. This KPI effectively measures the spaces in active use. | A low percentage suggests that many spaces on the site are no longer being used. Consider archiving the unused spaces to reduce clutter. |
| Updated spaces | Displays the number and percentage of the spaces in which at least one content (page or blog post) was updated in the last 90 days. This KPI effectively measures the spaces under active maintenance. | A low percentage suggests that many spaces on the site may contain outdated content. Consider implementing a periodic review workflow to encourage users to update the content regularly. |
| Growing spaces | Displays the number and percentage of the spaces in which at least one new content (page or blog post) was created in the last 90 days. This KPI effectively measures the spaces under active development. | A low percentage indicates that your site is primarily in "maintenance mode", with little new content being added. This might be acceptable if the Updated Spaces KPI is high. |
| Most popular spaces |
Displays the spaces in which users viewed the most content (pages and blog posts) in the last 90 days. Displays these metrics for each space, sorted by Total views:
|
To improve Confluence content quality, focus on the most popular spaces as they are prime candidates. |
| Fastest changing spaces |
Displays the spaces in which users updated the most content (pages and blog posts) in the last 90 days. Displays these metrics for each space, sorted by Updates:
|
Investigate why these spaces are changing rapidly. Are there specific projects or topics driving the activity? Understanding this can help optimize your content strategies. |
| Fastest growing spaces |
Displays the spaces in which users created the most content (pages and blog posts) in the last 90 days. Displays these metrics for each space, sorted by New contents:
|
Keep an eye on the quality of the content being added. Rapid growth can sometimes lead to inconsistent or lower-quality content, so regular reviews are important. |
Security
The Space Analytics dashboard is available for all users. The dashboard respects the Confluence space permissions.
More precisely:
- If the app can't access a space or content (page or blog post), it will not collect analytics about it.
- Even if you can't view a space, it will contribute to the "total-type" analytics (like Viewed spaces).
- If you can't view a space, it will be listed as "Undisclosed" for you. Also, its analytics will be hidden.
As the dashboard is personalized for the user who opens it, your dashboard view and your teammate's may be different.
Questions?
Ask us any time.