
In this page
Scopes
User Analytics report for the site
User Analytics report for a space
Understand the User Analytics report
Users
Viewers
Contributors
Authors
Most active viewers
Most active contributors
Most active authors
Security
What is the User Analytics report?
The User Analytics dashboard provides KPIs and in-depth analytics on user activity within your Confluence site. It allows you to track how users interact with your content and identify 'power users' who are the most active, whether site-wide or in specific spaces. Use these insights to enhance collaboration and improve content management.
Quickly learn how to access and use the User Analytics dashboard:

Similar to other dashboards, the User Analytics dashboard transforms data on spaces, pages, blogs and users into clear summaries:
- You can gain insights about your users and their activities.
- You can view the number of users on the site.
- You can view the number of the users viewing, updating and creating contents on the site or in the space.
- You can view the top list of the most active "power-users".
Scopes
The User Analytics dashboard is available for the whole Confluence site and for any single space.
User Analytics report for the site
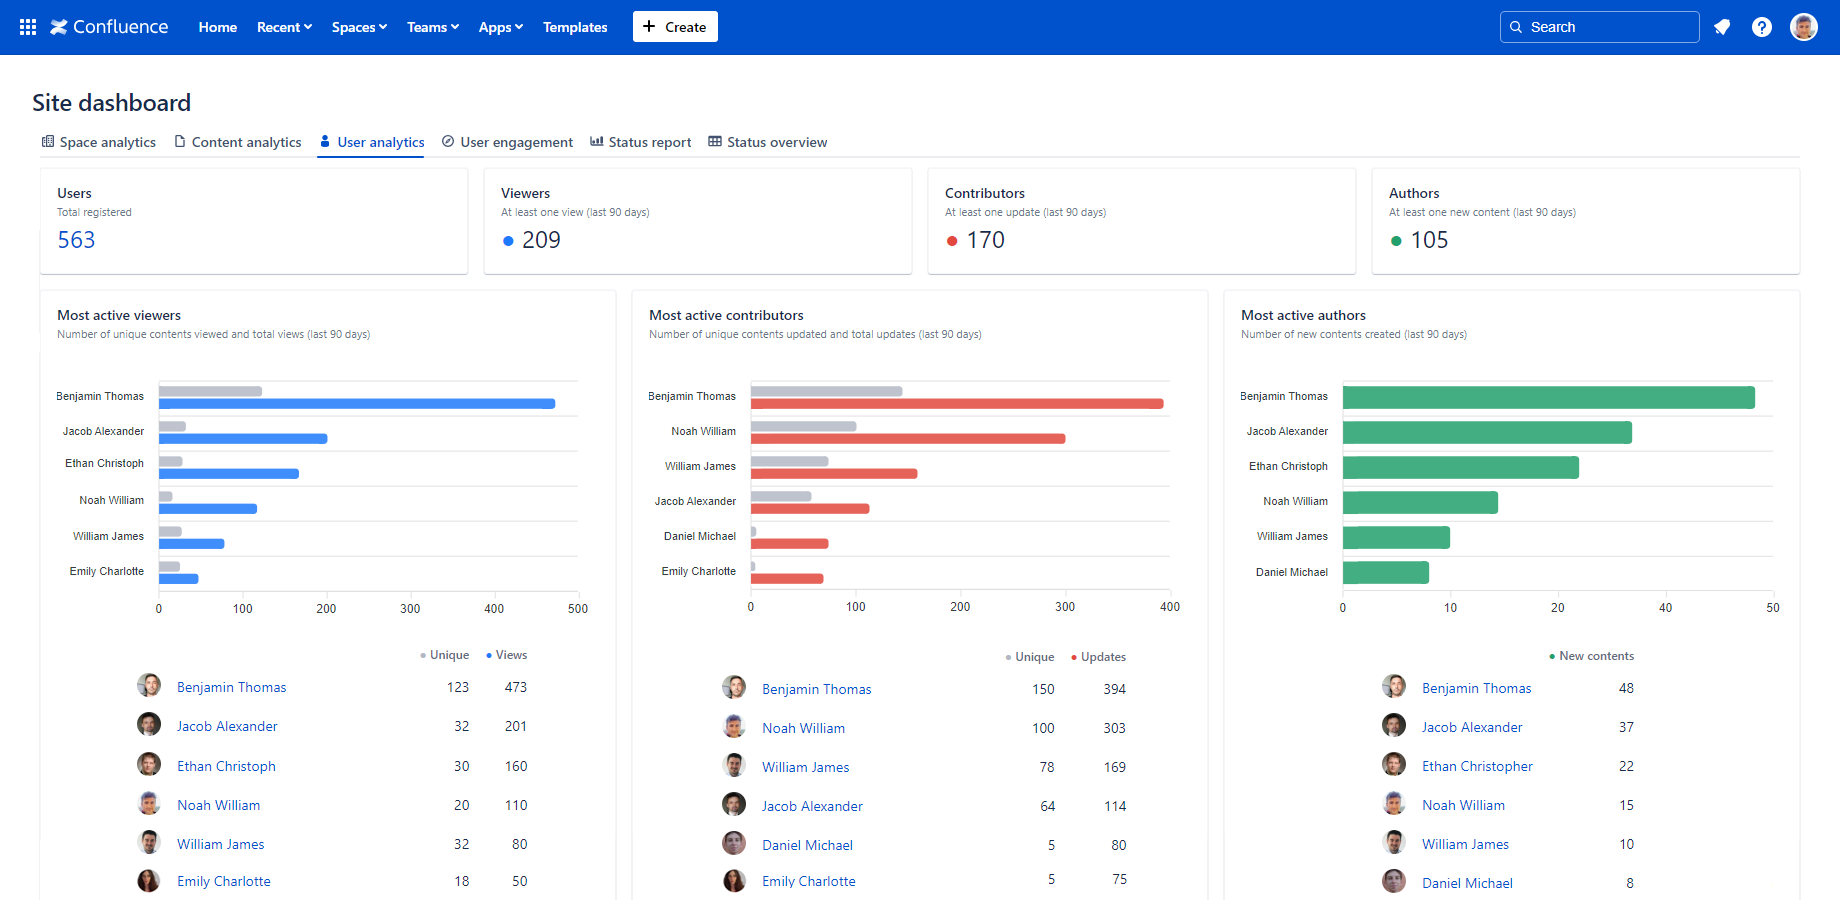
For the site scope report, expand the Apps section in the left-bar (not Space apps!) → click the Better Content Archiving app → User analytics tab. In this scope, the report covers all spaces, all contents and all activities on the site.
User Analytics report for a space
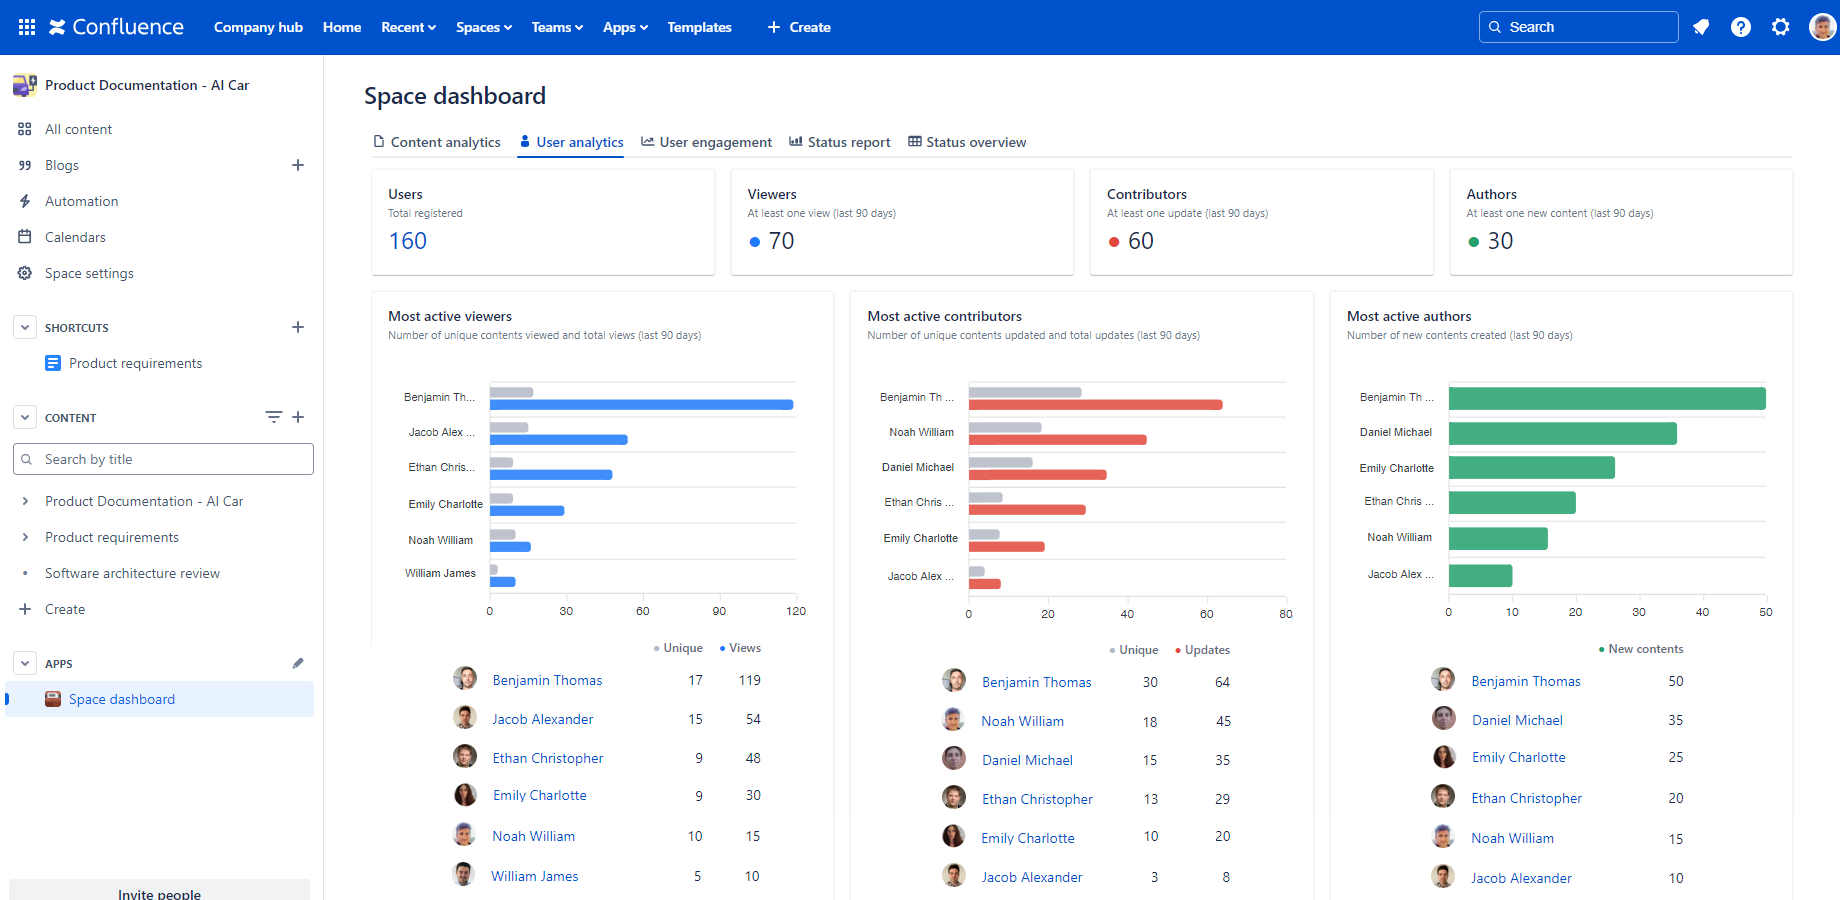
For the space scope report, go to the space → expand the Space apps section in the left-bar (not Apps!) → click the Better Content Archiving app → User analytics tab. In this scope, the report covers only that single space, the contents and the activities in it.
Understand the User Analytics report
The following section helps you understand the User analytics report by explaining each gadget.
| Gadget | Description | Notes |
|---|---|---|
| Users | Displays the total number of users registered on the Confluence site. | |
| Viewers | Displays the number and percentage of the users who viewed at least one content (page or blog post) in the last 90 days. This KPI effectively measures the users who are actively reading information in Confluence. | A low number indicates that a significant portion of your users are not utilizing Confluence at all. Consider reactivating users to improve content lifecycle management efficiency, or removing their accounts to reduce Confluence subscription costs. |
| Contributors | Displays the number and percentage of the users who updated at least one content (page or blog post) at least once in the last 90 days. This KPI effectively measures the users who are actively contributing to information in Confluence. | A low number indicates that a significant portion of your users may passively consume information without actively contributing. This could be fine if the Viewers KPI is high. However, if both metrics are low, it may indicate that your Confluence site is underutilized. |
| Authors | Displays the number and percentage of the users who created at least one new content (page or blog post) in the last 90 days. This KPI effectively measures the users who are actively adding new information to Confluence. | A low number indicates that only a small portion of your Confluence power-users are creating new pages from scratch. This might be acceptable, or it could suggest that users aren't sufficiently encouraged to do so. |
| Most active viewers |
Displays the users who viewed the most contents (pages or blog posts) in the last 90 days. Displays these metrics for each user, sorted by Views:
|
The most active viewers are likely key stakeholders who rely on the content for their work. Take a closer look at the per-page analytics for a clearer understanding of activities. |
| Most active contributors |
Displays the users who updated the most contents (pages or blog posts) in the last 90 days. Displays these metrics for each user, sorted by Updates:
|
These users are often the most knowledgeable in the subject matter. Knowing who the expert Confluence users are helps ensure that the content remains accurate, up-to-date, and reliable. |
| Most active authors |
Displays the users who created the most contents (pages or blog posts) in the last 90 days. Displays these metrics for each user:
|
These users are responsible for creating the majority of new content. Identifying the top users in Confluence helps highlight any content gaps that may need attention. |
Security
The User Analytics dashboard is available for all users.
More precisely:
- If the app can't access a space or content (page or blog post), it will not collect analytics about it.
- Even if you can't view a content, it will contribute to the "actor-type" analytics (like Viewers).
As the dashboard is personalized for the user who opens it, your dashboard view and your teammate's may be different.
Questions?
Ask us any time.