

In this page
Work with the job audit log
Filter the job audit log
View the job audit log record details
View the job execution logs
What is the job audit log?
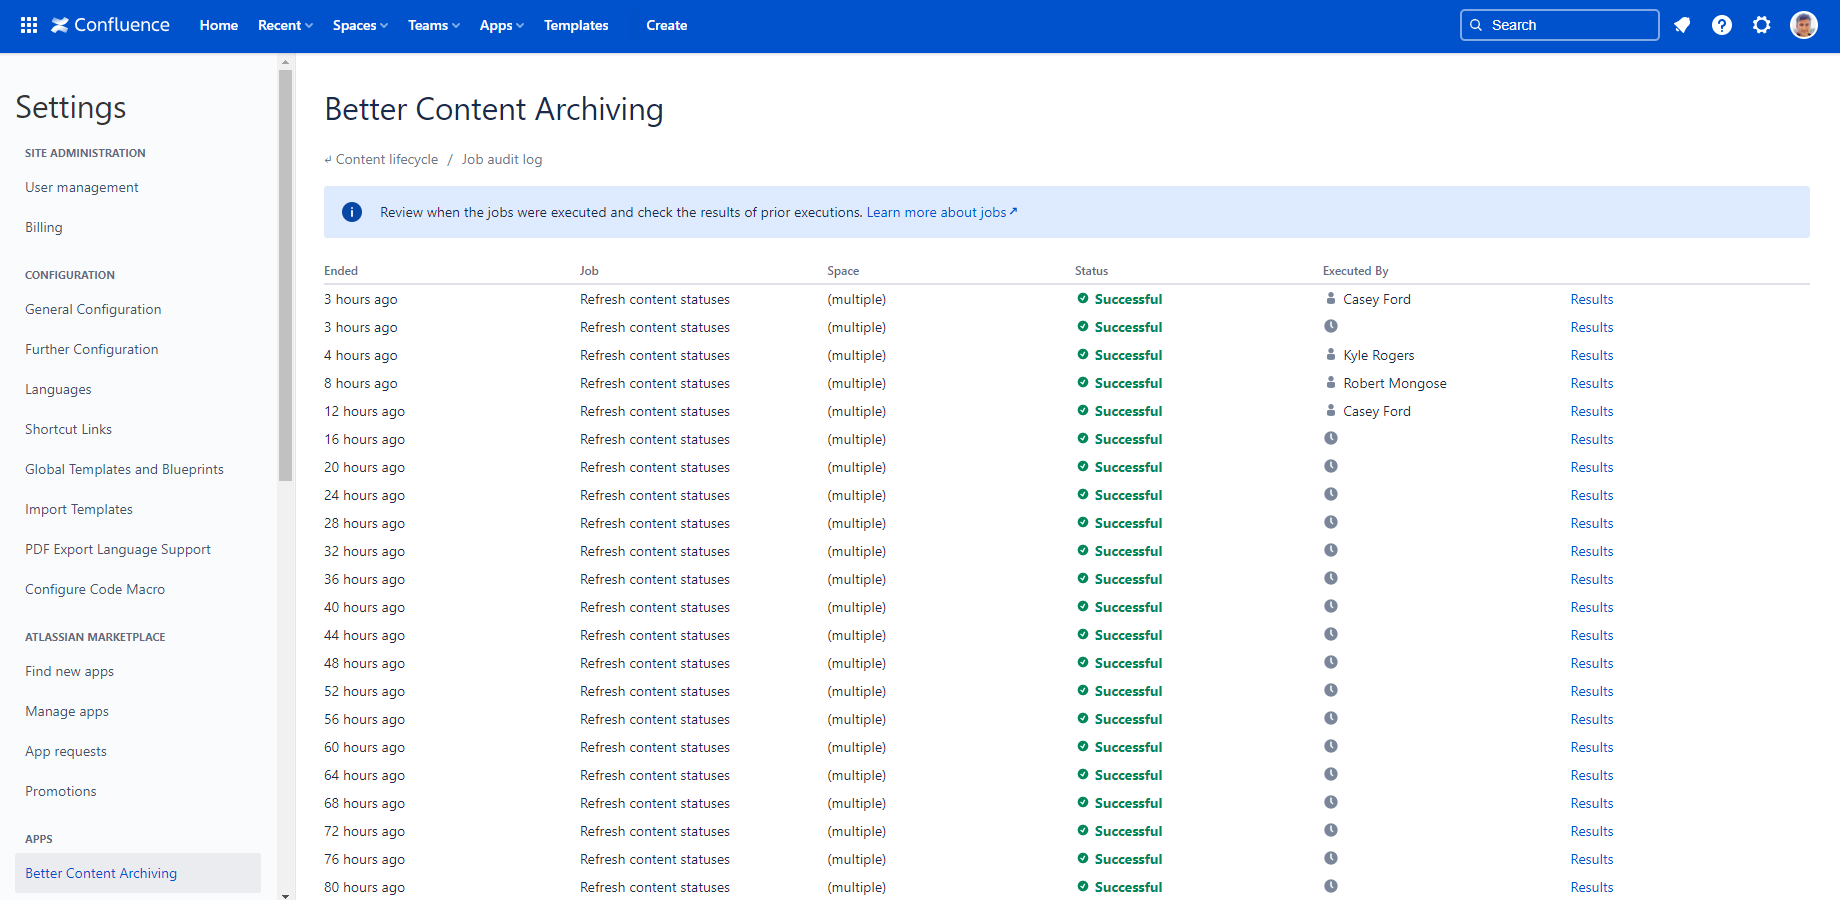
The job audit log is a collection of records that preserve the job execution history and results.
The job audit log is useful for:
- troubleshooting jobs (e.g. we don't receive the notification emails, is the job executing at all?)
- content audits (e.g. we already have 123 expired pages in Confluence, is the trend increasing, stagnating or decreasing?)
- looking up past job executions (e.g. we received unexpected notification emails, who ran the job that sent those?)
Work with the job audit log
There are two scopes where you can see the job audit log:
- Site scope: Go to Confluence Settings (cog icon "⚙" in the top right) → Apps → Better Content Archiving → Job audit log. You can see every job execution here, including both site scope ones and space scope ones.
- Space scope: Go to the space → Space Settings → Integrations → Better Content Archiving → Job audit log. You can see the job executions that were executed only in this space (space scope).
The table displays the job executions, with the most recent one in the top:
Filter the job audit log
Using the filters above the table, you can narrow down the list of executions according to the following criteria:
- Job type: Select the type of job you want to see executions of.
- Status: Select whether you want to see executions that succeeded (Successful), failed (Failure), or were cancelled (Cancelled).
- Execution: Select whether you want to see scheduled or manual executions.
View the job audit log record details
Click "Results" in the last column to get more details about a particular job execution:
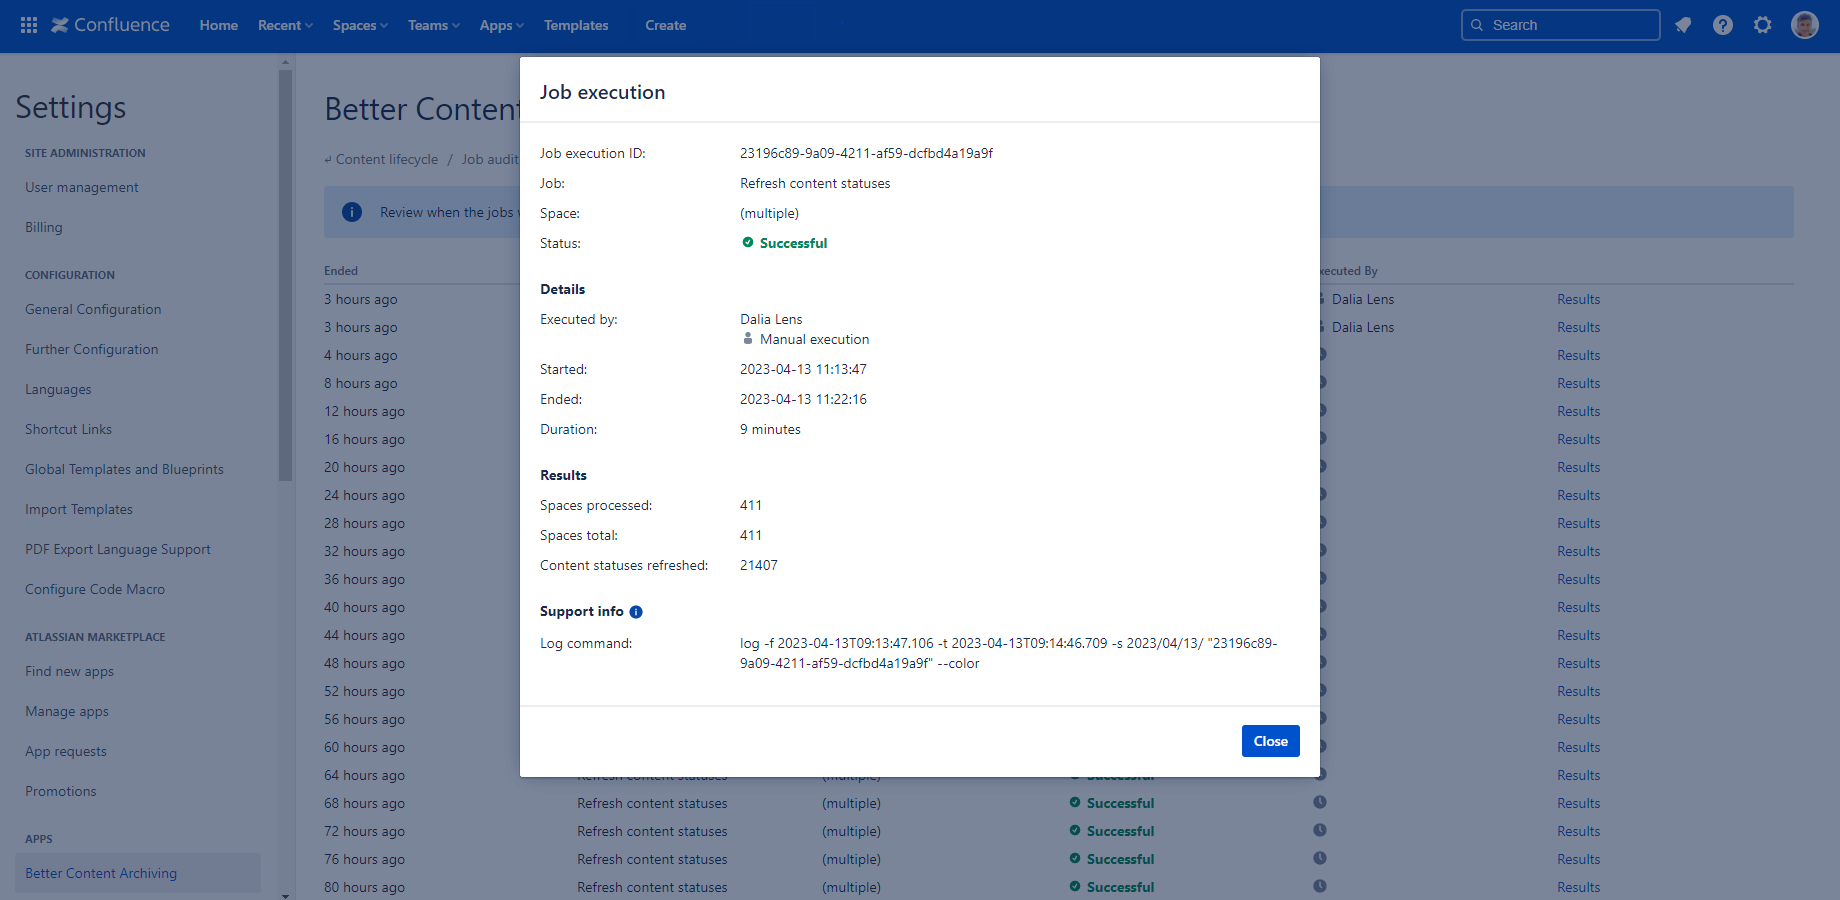
The following data is shown:
- Job execution ID: The unique identifier of the job execution.
- Job: The type of the job.
- Space: The text "(multiple)" if it was a site scope job execution, or the name of the space if it was a space scope one.
- Status: The final status of the job execution (Successful, Failed or Cancelled).
- Details
- Executed by: The text "Scheduled execution" if it was a scheduled job execution, or the name of the user who started the job if it was a manual one.
- Started: The exact time the job was started.
- Ended: The exact time the job has finished.
- Duration: The duration of the job execution.
- Metrics (a sub-set of the followings depending on the job type)
- Spaces processed: The number of spaces that were successfully processed.
- Spaces total: The number of spaces that the job was intended to process. This value depends on the job type and several other factors. It may change between executions.
- Content events initialized: The number of contents whose events have been initialized.
- Content statuses cleared: The number of contents whose statuses have been cleared (due to exclusion of the enclosing space).
- Content statuses refreshed: The number of contents whose statuses have been refreshed.
- Content owners refreshed: The number of contents whose owners have been refreshed.
- Emails sent: The number of emails sent.
- Contents archived: The number of pages which have been archived.
- Contents deleted: The number of contents which have been deleted (removed logically).
- Contents purged: The number of contents which have been purged (removed permanently).
- Support info
- Log command: Send this to our support if you have a problem with the job execution.
View the job execution logs
Some problems, such as missing permissions, don't fail the job, but are still worth checking. If there are any log entries for an execution, click the Logs link in the last column to view them:
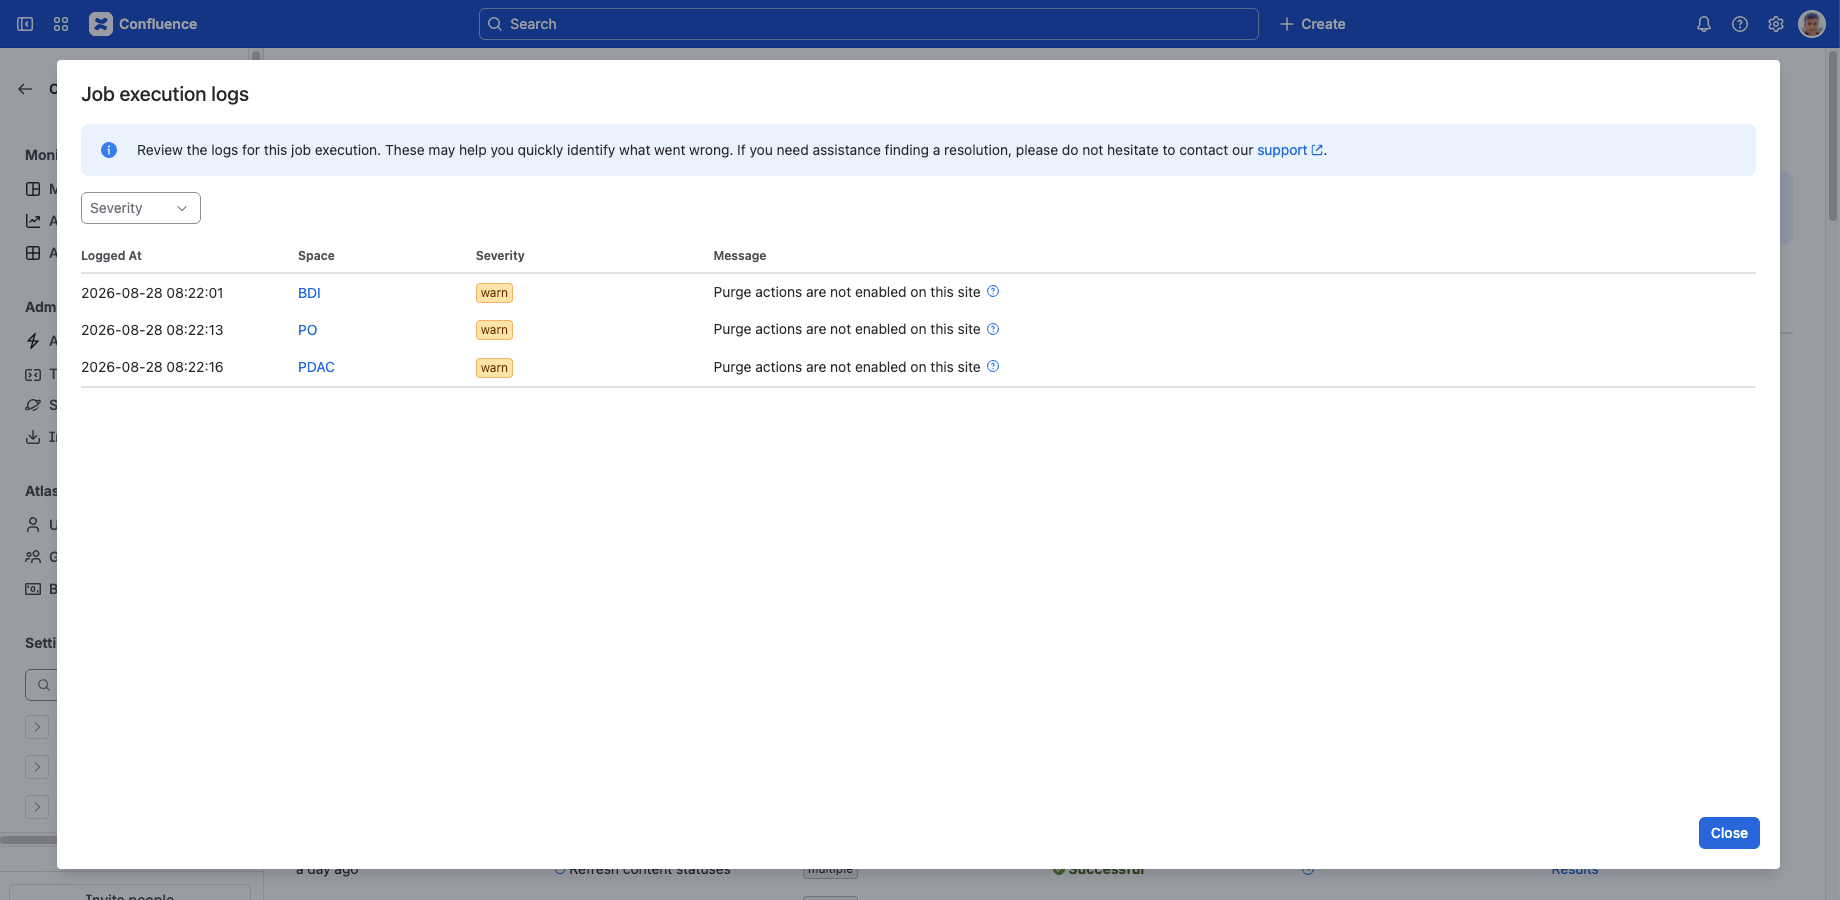
The "Job execution logs" dialog shows the following columns:
- Logged At: The timestamp of the logged event.
- Space: The space that was being processed when the event occurred. Clicking it opens that space. Only shown if the job execution logs dialog was opened from the global scope.
- Severity: Indicates how serious the event was. Can be one of the below:
- INFO: The event did not interfere with execution, but it may be useful for understanding what happened.
- WARN: The event indicates a potential problem, usually a configuration issue.
- ERROR: The event indicates an unexpected, mostly technical issue that may prevent execution from completing.
- Message: A brief description of the event. The "?" icon opens the corresponding page of the app's documentation.
At the top, you can filter on the severity of the log entries you want to see in the list.
Questions?
Ask us any time.